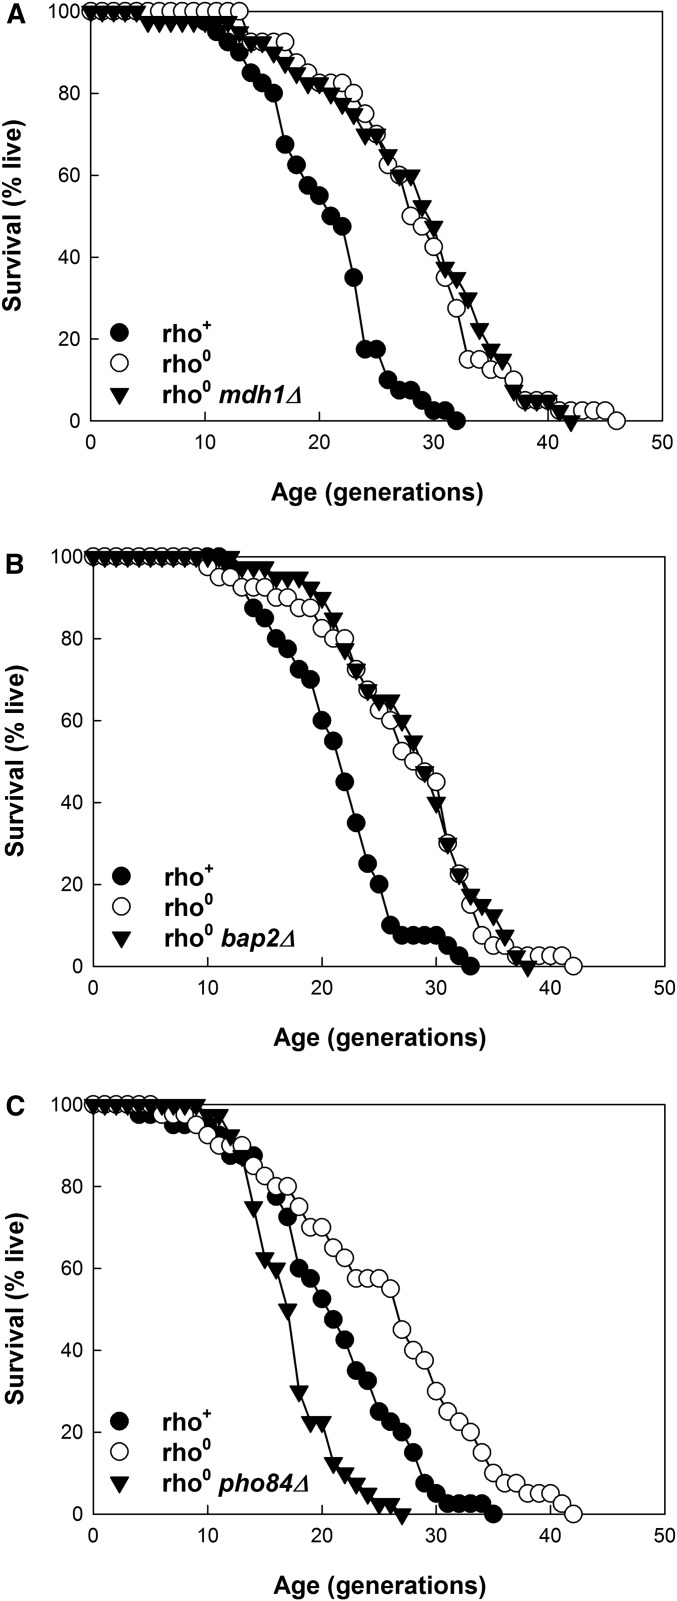
Figure 5.
Effect of deletion of the genes at the intersection of the retrograde response, SAGA, and ORF-ORC on RLS extension in rho0 strains. (A) Deletion of MDH1. Mean RLS are 19.7, 27.3, and 27.3, for rho+, rho0, and rho0 mdh1Δ strains, respectively. Lifespans for the first and second strain are significantly different (P < 0.001). They are not significantly different for the second and third strain (P = 0.736). (B) Deletion of BAP2. Mean RLS are 20.5, 26.2, and 27.0, for rho+, rho0, and rho0 bap2Δ strains, respectively. Lifespans for the first and second strain are significantly different (P < 0.001). They are not significantly different for the second and third strain (P = 0.765). (C) Deletion of PHO84. Mean RLS are 19.9, 24.3, and 16.4 for rho+, rho0, and rho0 pho84Δ strains, respectively. Lifespans for the first and second strain and for the second and third strain are significantly different (P = 0.019 and P < 0.001, respectively).

