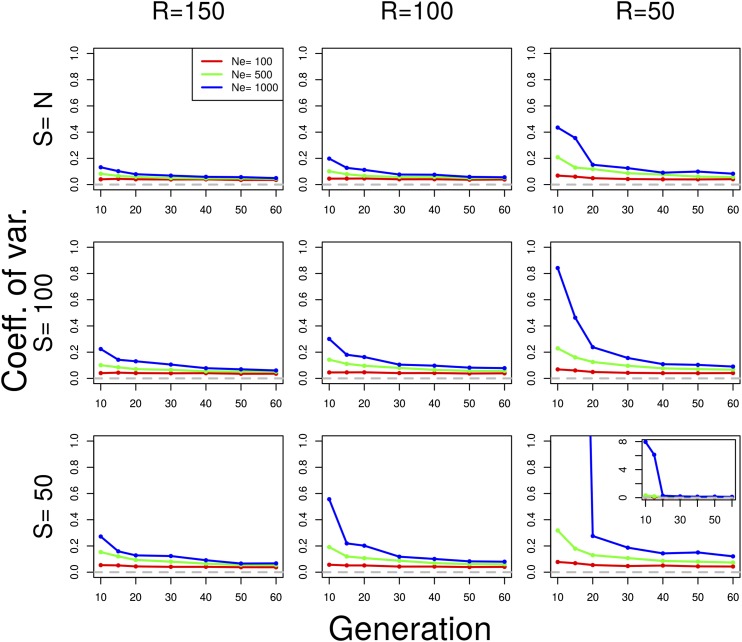
Figure 3.
Coefficient of variation of under plan I for various parameter values. Neutral Wright–Fisher simulations were performed with various combinations of the parameters: effective population size ( diploid individuals), pool size (), and coverage (). was estimated with under plan I, using SNPs. indicates scenarios when the whole population is sequenced as a single pool. For all simulations, we assumed Each value is calculated over 100 simulations. When the coefficient of variation exceeds one, the inset shows the actual value.

