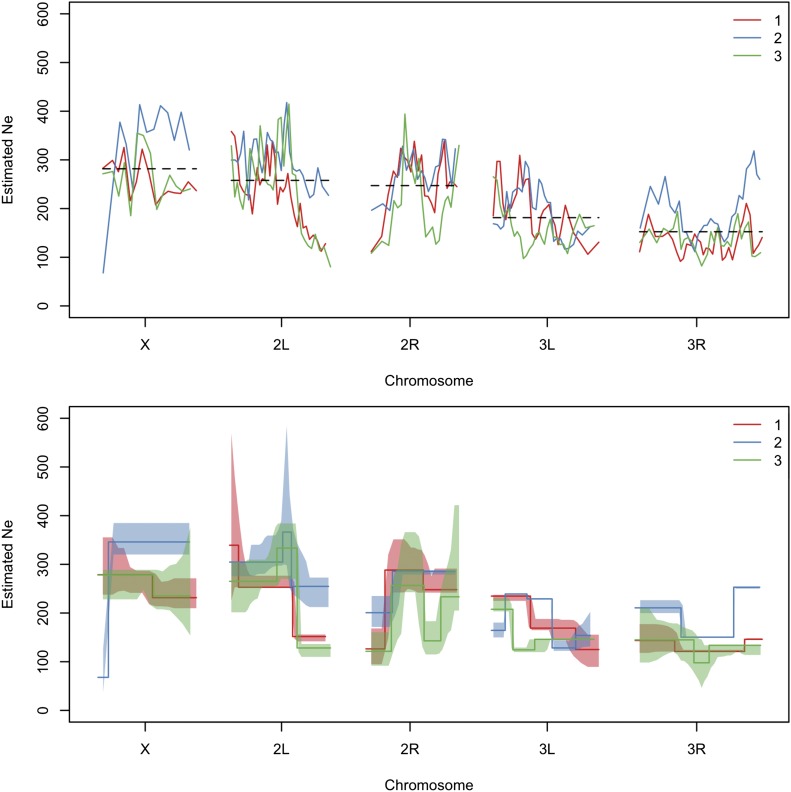
Figure 7.
Genome-wide from an E&R study with D. melanogaster. is estimated based on the allele frequency changes between founder and evolved populations at generation 59 (Franssen et al. 2015). In the top panel, we show genome-wide estimates calculated with (plan I), using as census size and as pool size (Orozco-terWengel et al. 2012) and nonoverlapping windows of 10,000 SNPs. Chromosome-wide mean estimates across replicates are shown by the dashed lines and also calculated separately for each replicate in Table 1. DNA stretches with significantly different are determined using the stepR software package (Frick et al. 2014) (bottom panel). Lower and upper confidence bands are shown as shaded areas. α controls the error, i.e., the probability for overestimating the number of change points, and is calculated automatically as described in Frick et al. (2014). The colors indicate different biological replicates.

