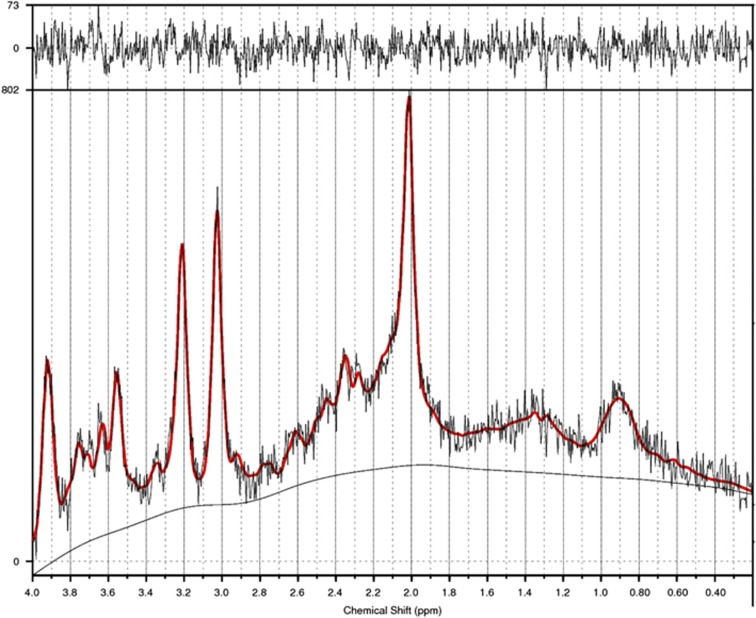
Figure 2.
An example of LCModel output for magnetic resonance spectroscopy spectrum from the hippocampus. The red solid line indicates the summary of all fitted metabolites' peaks. For N-acetylaspartate (NAA), the major peak is located at 2.02 p.p.m. Mean NAA across all groups (N=82) was 6.35 (s.d.=0.97). Separately for each group, mean NAA values were as follows: healthy control, 6.40 (s.d.=0.89); CBDx, 6.28 (s.d.=0.90); CBD−, 5.82 (s.d.=1.11); CBD+, 6.54 (s.d.=0.76); and Former Users, 6.94 (s.d.=0.86).

