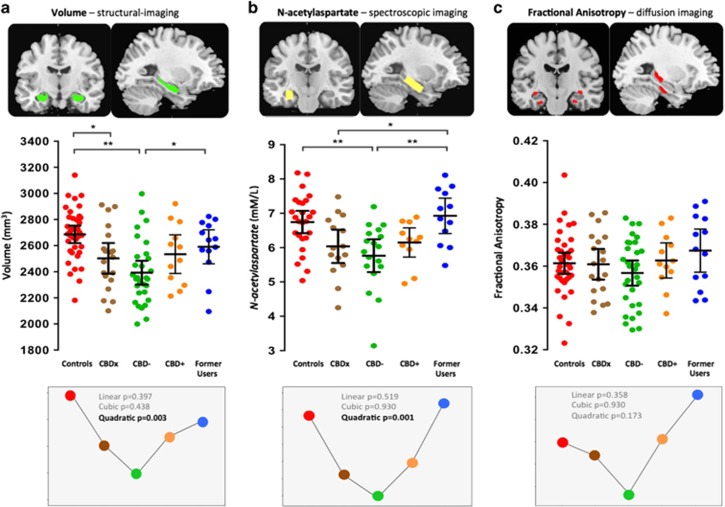
Figure 4.
Scatter plots illustrate hippocampal: (a) volume; (b) N-acetylaspartate; and (c) fractional anisotropy levels in long-term cannabis users and non-using controls. Controls (n=37) are shown in red. Long-term cannabis users (n=74) comprise three groups: CBDx, those with unknown exposure to CBD (n=19, in brown); CBD−, those known to be exposed to THC but not to CBD (n=30, in green); and CBD+, those exposed to both THC and CBD (n=12, in orange). Former Users, former long-term cannabis users, abstinent for a mean 29 months (n=13, in blue). Horizontal lines represent group means and horizontal bars are the 95% confidence interval. *P<0.05; **P<0.005. Lower panels illustrate the curve-fitting and polynomial contrasts that were applied to the data across the five groups to model our investigational aims.

