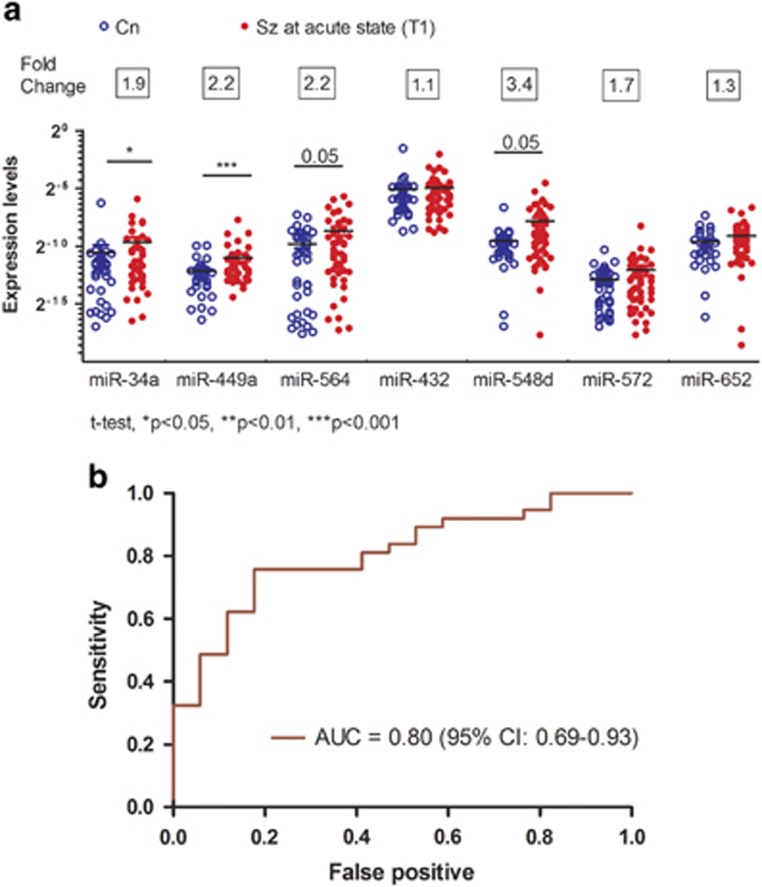
Figure 1.
Comparison between people with schizophrenia and controls in peripheral blood cohort. (a) The relative expression levels of the seven-miRNA in the peripheral blood cohort of controls (Cn) (n=37, hollow circles) and people with schizophrenia (Sz) (n=48, solid circles) at acute state (T1), *P<0.05 and ***P<0.001. (b) The area under receiver operating characteristic curve (AUC) of the seven-miRNA signature in distinguishing the Sz and Cn.

