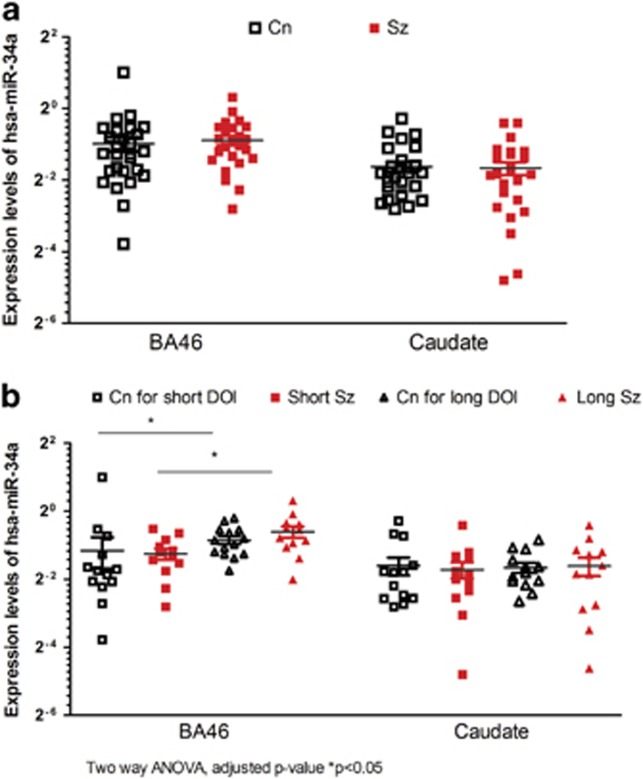
Figure 3.
(a) Expression levels of hsa-miR-34a in BA46 and caudate of healthy control (Cn, n=27) and people with schizophrenia (Sz, n=25). (b) Expression levels of hsa-miR-34a in BA46 and caudate of non-psychiatric controls (Cn for short DOI, n=13; Cn for long DOI, n=14) and people with schizophrenia with short (Short Sz, n=13, solid square) or long duration of illness (Long Sz, n=12, solid triangle) *P < 0.05.

