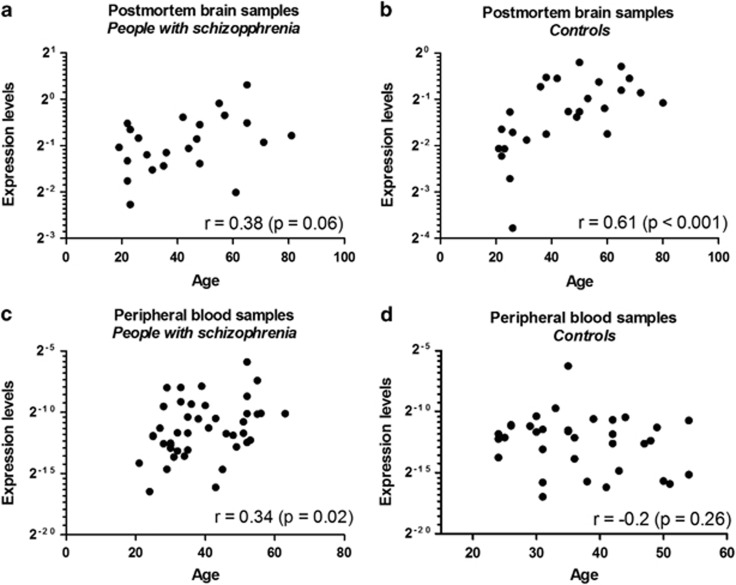
Figure 4.
Scatter plot of age and hsa-miR-34a expression levels in BA46 (a) of people with schizophrenia (n=23) and (b) healthy controls (n=26) and in PBMCs of (c) people with schizophrenia (n=43) and (d) healthy controls (n=34). The correlation coefficient and its P-value were indicated by r and p, respectively.

