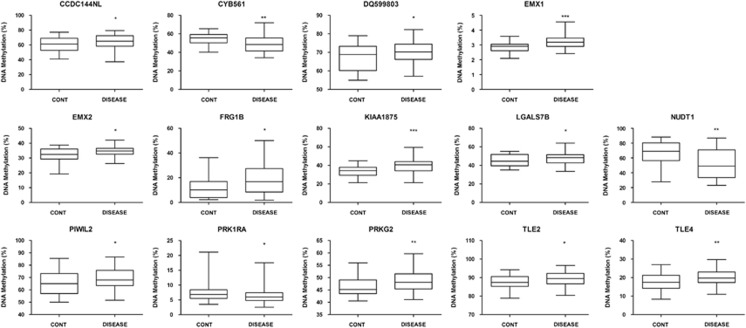
Figure 4.
Pyrosequencing validation of candidates genes with a shared CpG methylation shift in all neurodegenerative diseases. The box-plots show the distribution of CpG methylation for each gene in control gray matter and the four neurodegenerative disorders. The central solid line represents the median; the limits of the box indicate the upper and lower quartiles. The whiskers represent the minimum and maximum values, excluding outliers (<1.5 × the interquartile range). *P<0.05; **P<0.01; and ***P<0.001 in Fisher's exact test.

