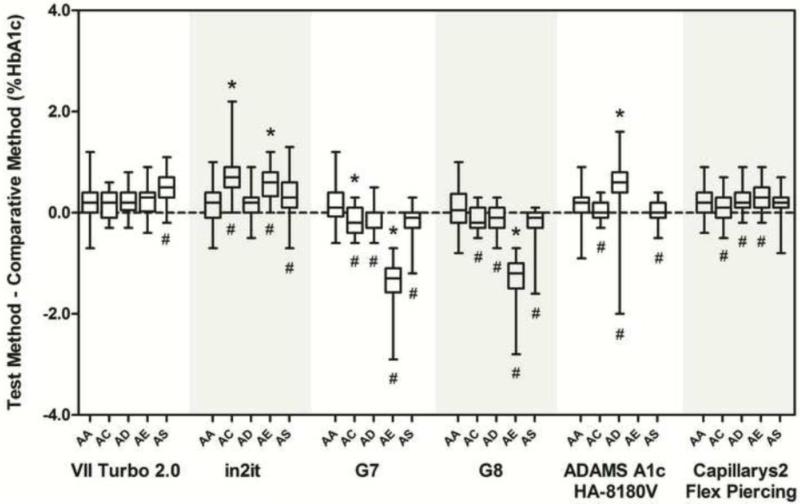
Figure 1.
Box plots showing the absolute differences between each assay and the comparative method for each hemoglobin type. The horizontal line inside each box is the median difference between the test and comparative methods. The upper and lower limits of each box correspond to the 25th and 75th percentiles of the differences, respectively. The upper and lower bars represent the maximum and minimum differences between the comparative methods. Differences from HbAA that are statistically significant are indicated (#) below each bar where appropriate; clinically significant differences are indicated (*) above each bar where appropriate.

