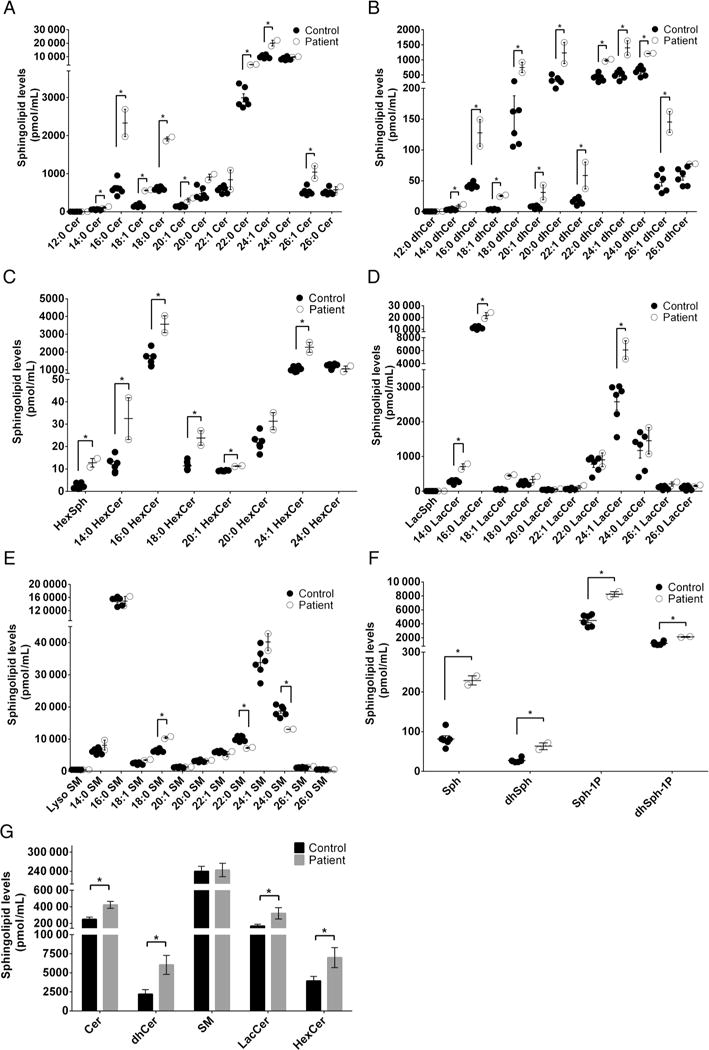
Figure 7.

Sphingolipid profile in blood. Blood samples were collected from the five healthy individuals (Control) and the two patients (Patient). Each of the blood samples (100 μL) was subjected to liquid chromatography-tandem mass spectrometry (LC-MS/MS) for the levels of individual ceramides (A), individual dihydroceramides (B), individual monohexosylceramides (C), individual lactosylceramides (D), individual sphingomyelins (E), sphingoid bases and their phosphates (F) and total amount of each type of sphingolipids (G). Data represent mean values±SD, n=2 (patients) or 5 (controls). *p<0.05.
