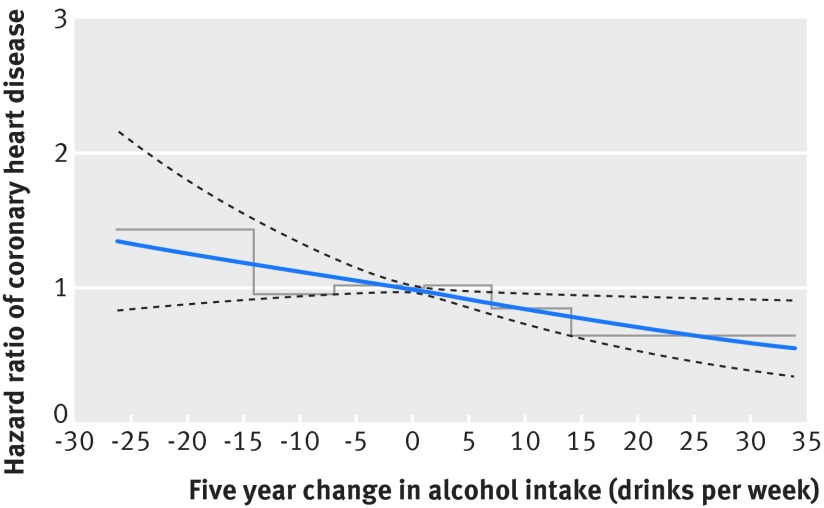
Fig 2 Hazard ratios of coronary heart disease among postmenopausal women by five year change in alcohol intake. Blue solid curve (black dashed lines)=hazard ratios (95% confidence intervals) of coronary heart disease by change in alcohol intake from the 1993-98 to the 1999-2003 examinations, modelled by cubic splines; stepped line=hazard ratios of coronary heart disease for seven categories of change in alcohol intake. Women who changed their alcohol intake outside the 0.5-99.5% percentiles of the distribution of change in alcohol intake were excluded from analyses presented in the figure, resulting in 20 433 women and 1730 cases of coronary heart disease eligible for analysis. Estimates are adjusted for age, education, body mass index, Mediterranean diet score, smoking, physical activity, hypertension, elevated cholesterol, diabetes, and alcohol intake in the 1993-98 examination

An official website of the United States government
Here's how you know
Official websites use .gov
A
.gov website belongs to an official
government organization in the United States.
Secure .gov websites use HTTPS
A lock (
) or https:// means you've safely
connected to the .gov website. Share sensitive
information only on official, secure websites.
