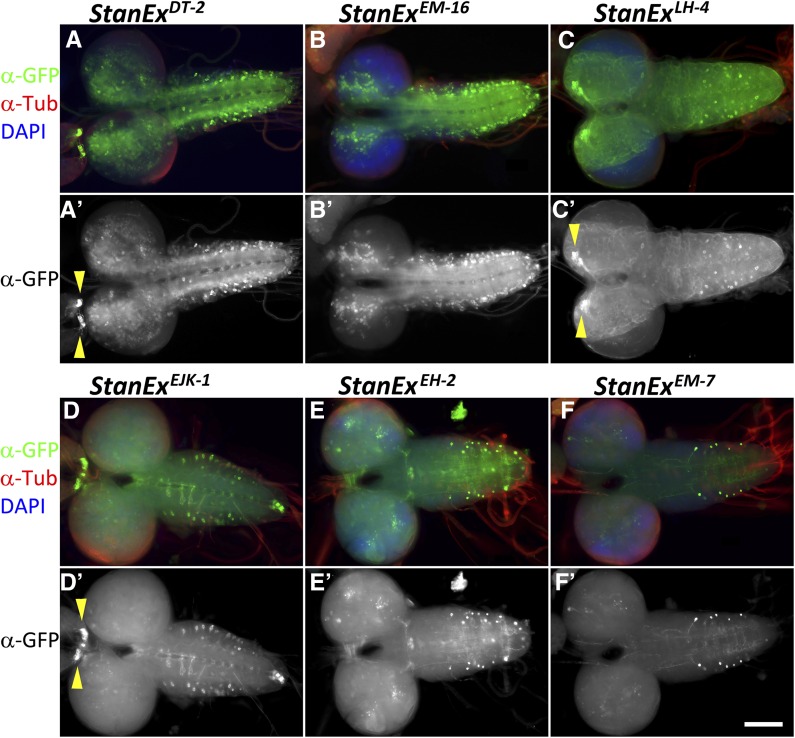
Figure 3.
Immunohistochemical analysis of individual StanEx enhancer trap line expression in larval brain and VNC. Third larval instar CNS and VNC expression of LexA::HG is visualized by LexAop-CD8::GFP. (A, A′) w; StanExDT-2/ LexAop-CD8::GFP. Arrowheads in A′ mark CC cells. (B, B′) w; StanExEM-16/ LexAop-CD8::GFP. (C, C′) w; StanExLH4/+; LexAop-CD8::GFP/+. Arrowheads in C′ mark IPCs. (D, D′) w; StanExEJK-1/LexAop-CD8::GFP. Arrowheads in D′ mark CC cells. (E, E′) w; StanExEH-2/LexAop-CD8::GFP. (F, F′) w; StanExEM-7/LexAop-CD8::GFP. Green, Anti-GFP; Red, Anti-Tubulin; Blue, DAPI. Scale bar = 100 μm.

