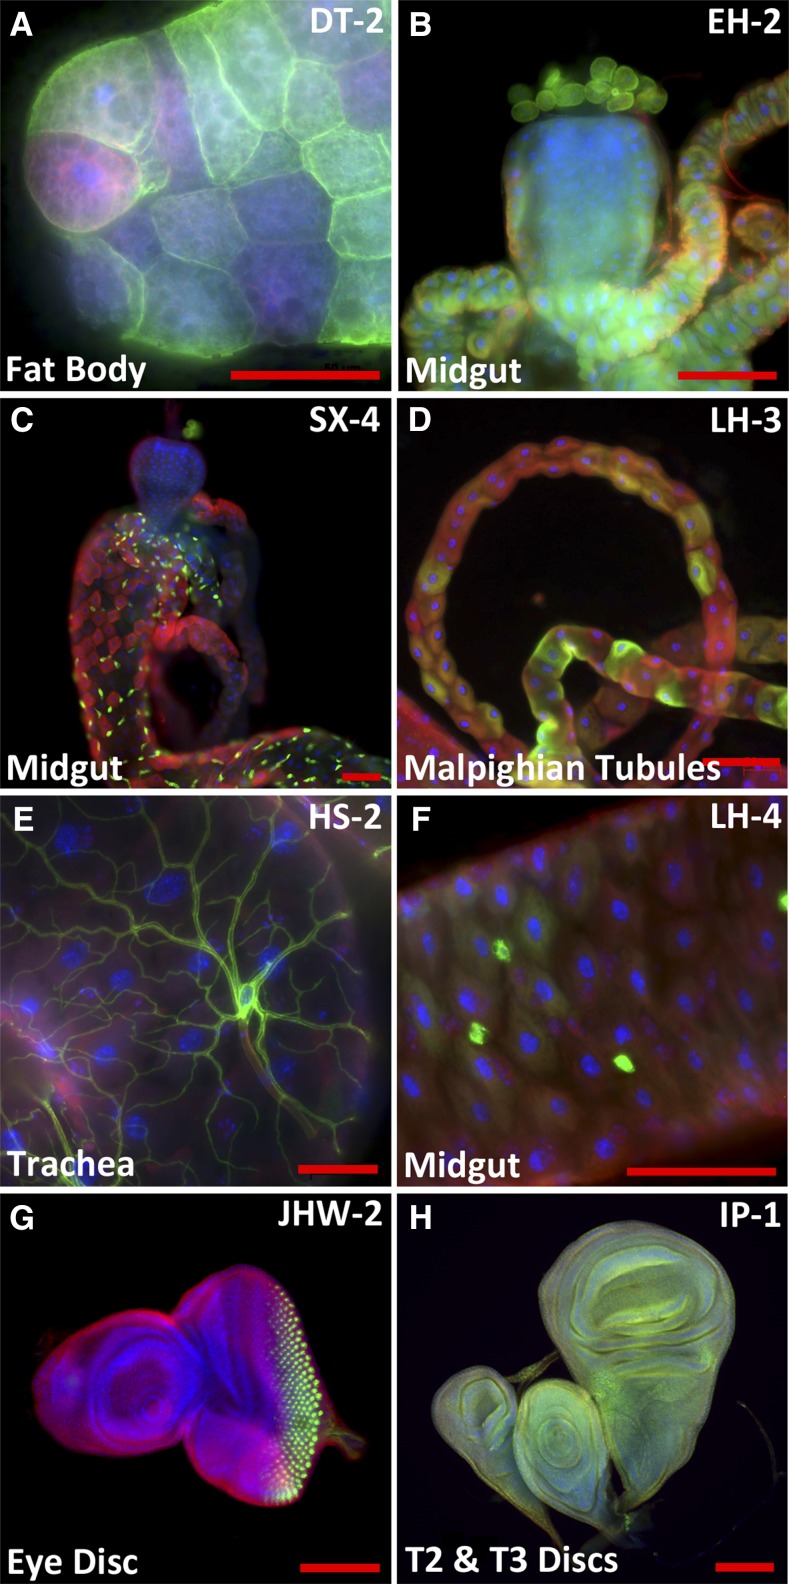
Figure 4.
Immunohistochemical analysis of StanEx enhancer trap expression in third instar larval tissue visualized by LexAop-CD8::GFP. (A) w; StanExDT-2/LexAop-CD8::GFP. Expression in fat body. Note the variable expression in fat body cells. (B) w; StanExEH-2/LexAop-CD8::GFP. Expression in anterior midgut. Note that expression in garland nephrocytes is lexAop-CD8:GFP background signal (see Materials and Methods and Figure S6). (C) w; StanExSX-4/+; LexAop-CD8::GFP/+. Expression in midgut. (D) w; StanExLH-3/+; LexAop-CD8::GFP/+. Expression in malphigian tubules. Note the variable expression in individual cells. (E) w; StanExHS-2/LexAop-CD8::GFP. Expression in trachea located on midgut. (F) w; StanExLH-4/LexAop-CD8::GFP. Expression in small cells in midgut consistent with expression patterns of entero-endocrine cells. (G) w; StanExJHW-2/LexAop-CD8::GFP. Expression in photoreceptor clusters in third instar eye disc. (H) w; StanExIP-1/+; LexAop-CD8::GFP/+. Expression in third instar haltere, leg, and wing disc. Green, Anti-GFP; Red, Anti-Tubulin; Blue, DAPI. Scale bar = 50 μm.

