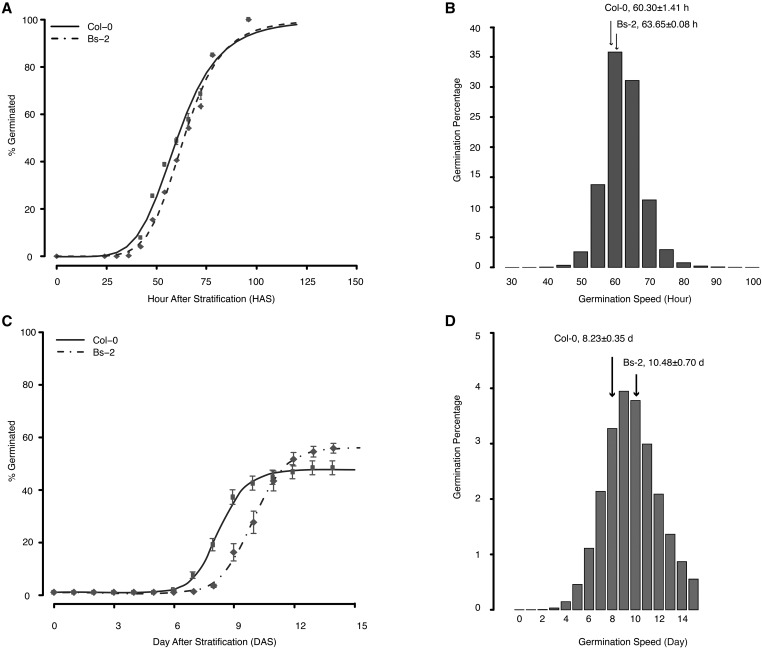
Figure 1.
Germination speed of the founder accessions and their F3 populations under no-salt condition and extreme salinity. (A) Cumulative germination percentage of the founder accessions (Bs-2 and Col-0). Gray dots show the percentage germinated at each sampling time point, with the center of the dot indicating mean germination percentage, and the error bar showing the SE. Where error bars cannot be seen, they are because the size of the error bars at those time points are smaller than the size of the dots. The black lines show the 4PHF fitting result. Raw data were fitted to 4PHF with 100 maximum iteration and least sum-of-square method. Data from Yuan et al. (2016). (B) Histogram showing the distribution of germination speed in ∼100,000 Bs-2 × Col-0 F3 population. Data for plotting the histogram was derived from fitting raw F3 germination data to 4PHF. The germination speed of Bs-2 and Col-0 were indicated by the arrows. The F3 population exhibits transgressive segregation in germination speed Data from Yuan et al. (2016). (C) Cumulative germination percentage of the founder accessions under extreme salinity (250 mM NaCl). Compared to germination under no-salt condition (Figure 1A), both accessions showed significant delay in onset of germination (P < 2.2 × 10⁻¹⁶), reduction in final germination percentage (P = 5.3 × 10⁻¹⁰), and a greater difference between their germination speed (P = 2.7 × 10⁻⁹). (D) Histogram showing the distribution of germination speed in ∼100,000 F3 population under extreme salinity. The higher tail was cut off at the end of the experiment. The transgressive segregation of germination speed under salt is evident in the F3 population.

