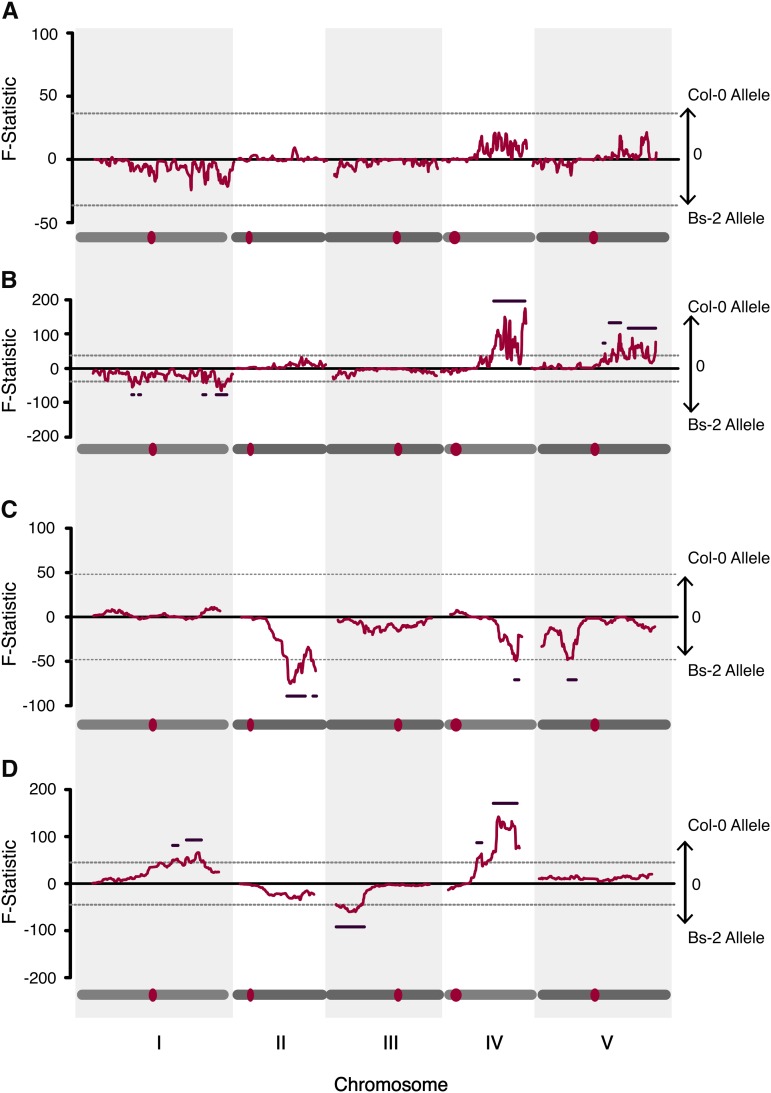
Figure 3.
Genetic architecture of germination speed under extreme salinity in Arabidopsis thaliana. Allele frequency of (A) all germinants, (B) early germinants, (C) late salt germinants, and (D) early germinants under no-salt condition. Figure 3D is generated with data from Yuan et al. (2016). Data were fitted to a sliding window, three-way nested ANOVA model. The F-statistic was plotted along the genome, with positive values indicating bias for the Col-0 allele and negative values for the Bs-2. Significance threshold (shown as gray dashed lines) and optimal window size were established via permutation. The dark thin bars within each plot indicate the QTL regions, and the gray bars underneath each panel indicate the chromosomes, and the red dots indicate the position of the centromere.

