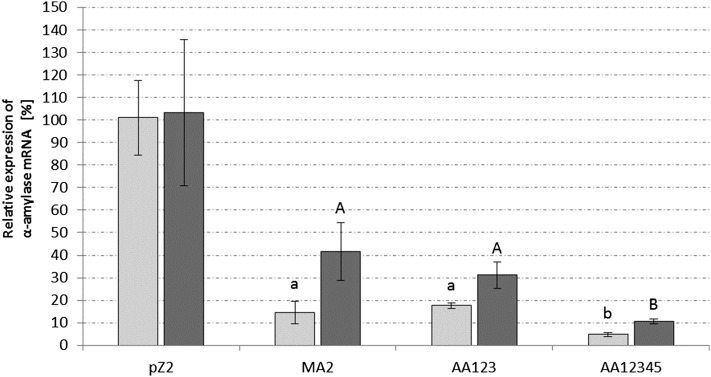
Figure 3.
Relative quantification of α-amylase mRNA via qPCR. Light gray columns represent samples taken in the early exponential growth stage, and dark gray represents samples taken in the late exponential growth stage. The primer pair QAA2-sp was used to measure α-amylase mRNA levels amplifying the region of AA2 and AA4 (Figure 1, A and B). The gene SSO3194, coding for glyceraldehyde-3-phosphate dehydrogenase, was used as a housekeeping gene. Three biological replicates were measured with three technical replicates, for each construct, respectively. All values present relative expression of α-amylase mRNA compared to control miniCR-pZ2 in percent. Significance to the control pZ2 was determined by a one-tailed t-test, n ≥ 3, with P ≤ 0.0063 for early growth stage (lowercase letters) and P ≤ 0.032 for the late growth stage (capital letters). Error bars represent SD (n ≥ 3). No significant difference between early and late growth stage was observed for the control construct pZ2.

