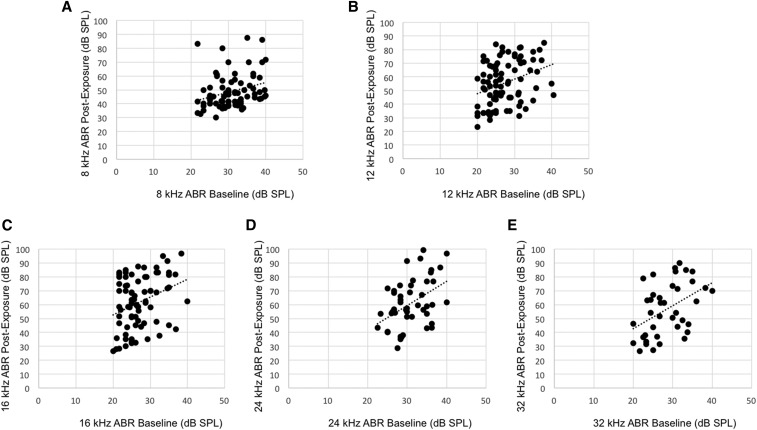
Figure 2.
Pairwise correlations between baseline ABR threshold and postnoise exposure threshold for 8, 12, 16, 24, and 32 kHz (A, B, C, D, and E, respectively) after exclusion of baseline hearing impaired strains. These plots were selected as they were representative of the correlations delineated in Table 2.

