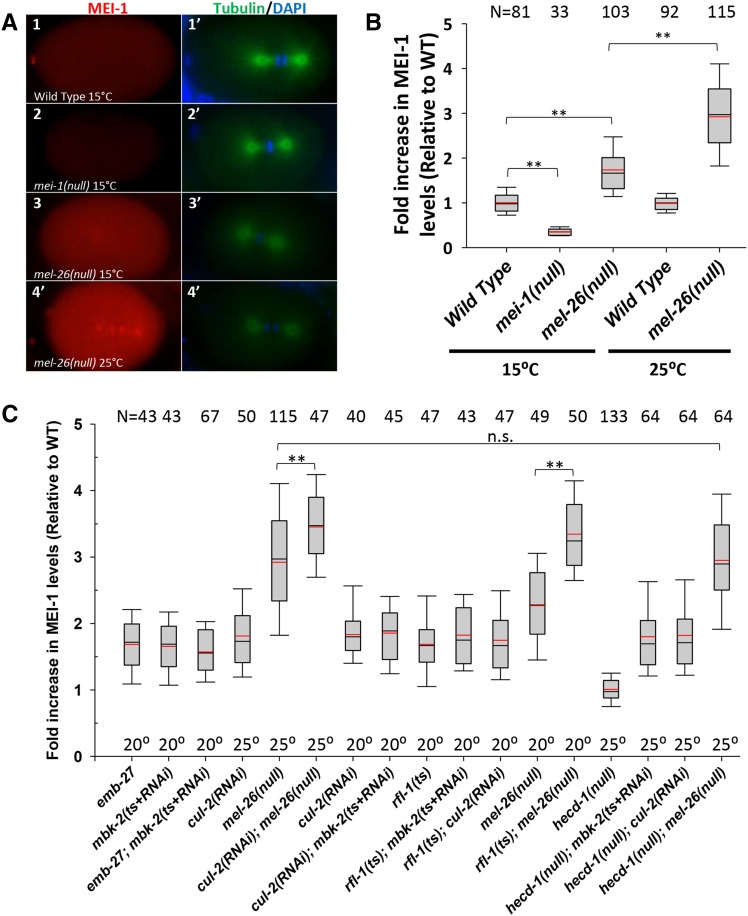
Figure 2.
Quantitative anti-MEI-1 indirect immunofluorescence in wild-type and mutant embryos. All strains (including “Wild Type”) contained tbb-2(sb26) to restore normal morphology to embryos that expressed ectopic MEI-1 for easier comparisons. (A) Embryos at the first mitotic cleavage. Anti-MEI-1 (red) is shown in the left column with the corresponding anti-tubulin (green) and DAPI (blue) shown in the right column. The low levels of MEI-1 present in the wild type (A1 and A1’) were above levels shown in mei-1(null) embryos (A2 and A2’) at 15°, demonstrating antibody specificity. Higher than wild-type levels of MEI-1 were present in mel-26(null) at 15° (A3 and A3′) and levels further increased at 25° (A4 and A4’). (B) Anti-MEI-1 mean pixel intensity measurements were subtracted from the nearby background and divided by the average of the wild type processed on the same slide (1.0 = average wild-type level). Data are pooled for one-to-four-cell cell embryos and for all stages of the cell cycle (see Figure S1 for unpooled data). Boxes indicate the 25th to the 75th percentiles and whiskers show the 10th and 90th percentiles. Black lines indicate the median and red lines the mean. **: P < 0.001. N values are shown at the top of the chart. (C) Quantification of anti-MEI-1 levels for mutant strains. emb-27; mbk-2 had similar levels of ectopic MEI-1 to the individual mutations, indicating the genes act in the same pathway. cul-2; mel-26 had higher MEI-1 than the singles, indicating the genes act in parallel. cul-2; mbk-2 was similar to the individual mutations, indicating these genes act in the same pathway. rfl-1 double mutants with mbk-2 or cul-2 had MEI-1 levels similar to single mutants, and so these genes act in the same pathway. rfl-1; mel-26 had elevated levels of MEI-1, and so those genes act in parallel. hecd-1 had wild-type MEI-1 levels and hecd-1 did not affect the levels found in mbk-2, cul-2, or mel-26, and so hecd-1 does not appear to be involved in the degradation pathways. **, P ≤ 0.001; n.s., not significant; P ≥ 0.13. All other double mutant combinations did not differ significantly (0.13 > P > 0.90) from the higher of the corresponding single mutants, but this is not shown for to simplify this figure. N values are shown at the top of the chart and temperature are along the bottom. DAPI, 4’, 6-diamidine-2’phenylindole dihydrochloride; RNAi, RNA interference; WT, wild-type.

