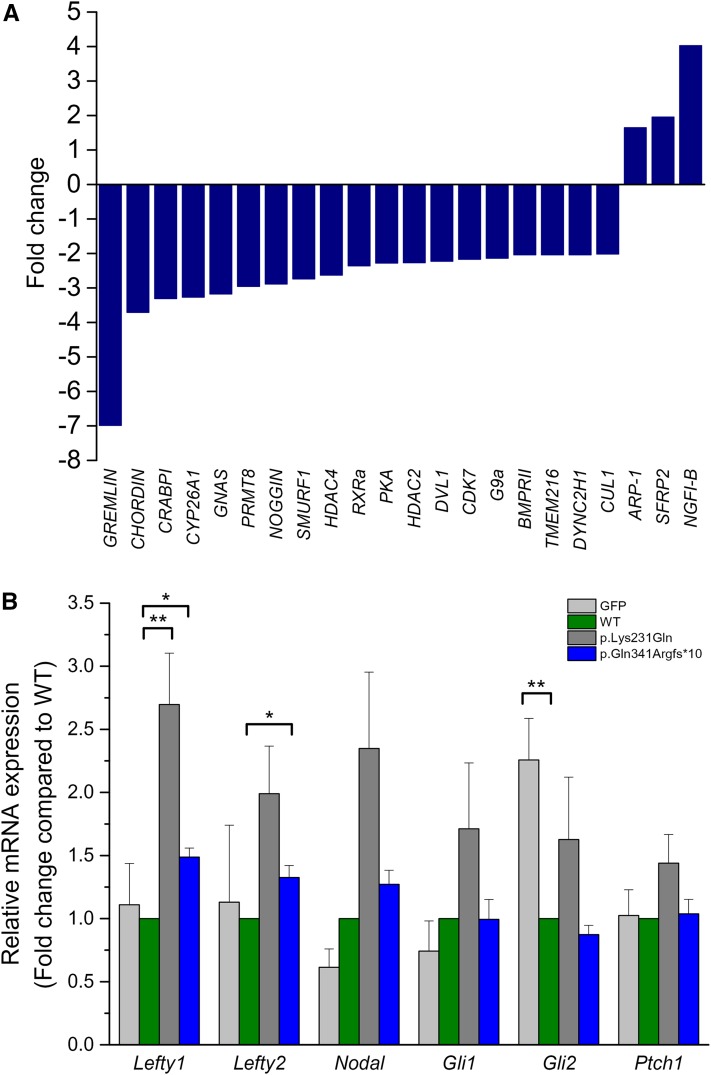
Figure 4.
DNAAF1 mutants alter the expression of neural development related genes. (A) Changes of NTC-related gene expression in DNAAF1 mutant and control brain tissues, measured by NanoString, presented as bar charts on a fold change scale. Relative transcript data compared to control are shown for each distinct gene. (B) Left–right patterning gene expression was examined in DNAAF1 wild-type (WT) and mutant transfected NE-4C cells using the real-time PCR analysis. Data were normalized to Gapdh levels and expressed relative to the expression of wild type. Shown are mean ± SEM, n = 3. The asterisk indicates a statistically significant difference in comparison with wild type (* P < 0.05; ** P < 0.01).

