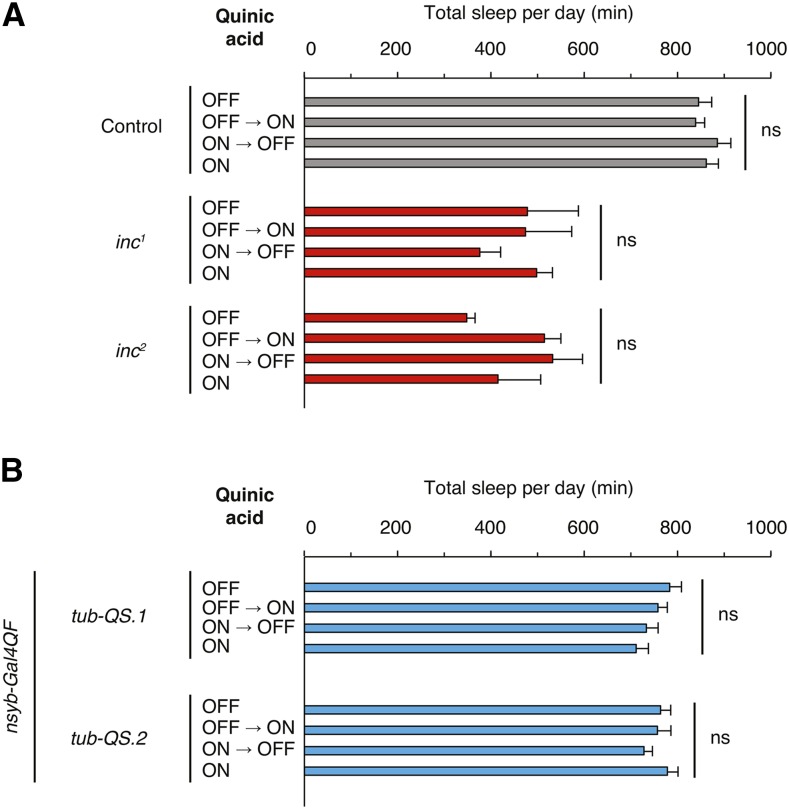
Figure 5.
The Q-system is compatible with assessing sleep. (A and B) Total sleep per day is plotted for animals of indicated genotypes and regimens of quinic acid exposure. Mean ± SEM is shown; n = 5–16 for (A); n = 22–24 for (B); ns denotes P > 0.05, for comparisons across induction conditions within each genotype.

