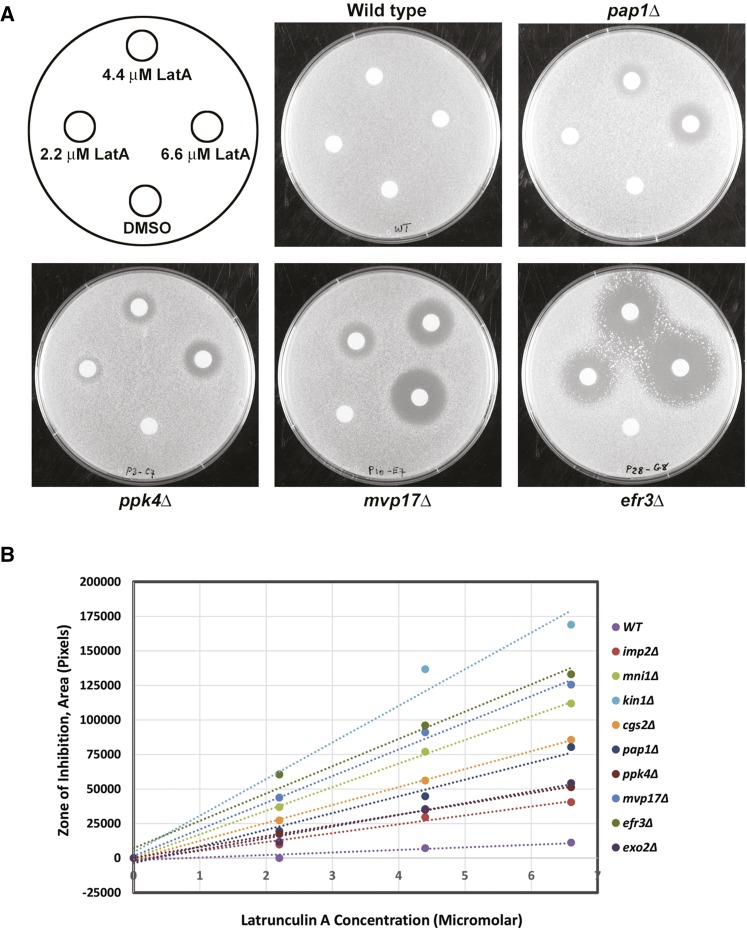
Figure 3.
Disk diffusion assays. (A) Filter paper disks soaked with 5 µl of DMSO (solvent control) or 2.2, 4.4, or 6.6 µM LatA, were placed on YES-agar plates impregnated with the indicated gene deletion mutants. Photographs were taken after 4 d incubation at 30°. The zones of growth inhibition surrounding each disk were measured and analyzed as described in Materials and Methods. (B) A plot of the area of the zone of inhibition vs. LatA concentration for a representative group of 10 gene deletion strains exhibiting varying sensitivity to LatA. The linear regression line through the points is plotted. The slope of this line was used as a quantitative measure to rank the LatA sensitivity of each strain.

