Figure 5.
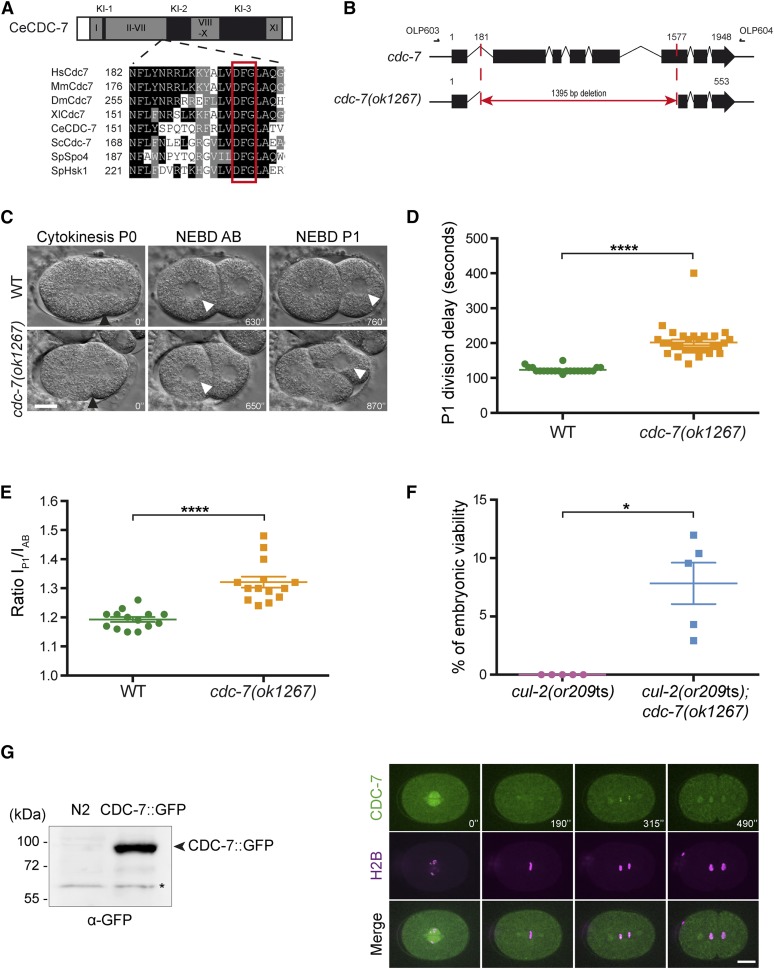
cdc-7 characterization in C. elegans. (A) Domain organization of C. elegans CDC-7. CDC-7 contains the typical kinase domains (I-XI) and the specific kinase inserts (KI) shown in gray and black respectively. Multiple protein sequence alignments corresponding to the region containing the conserved DFG motif in the II-VII Kinase domain in different organisms is presented. (B) Schematic representation of the cdc-7(ok1267) deletion allele. Deletion removes 1395 base pairs between the middle of intron 1 and the middle of exon 6. The position of the oligonucleotides (OLP603: 5′ agaaggacaactggctccaa 3′ and OLP604: 5′ caacacagcaagcgagaaaa 3′) used to genotype the wild type and cdc-7(ok1267) deletion strains are indicated. (C) DIC images from time-lapse video recording wild-type (N2) and cdc-7(ok1267) embryos. Black arrowheads indicate cleavage furrow ingression; white arrowheads indicate nuclei undergoing NEBD, which is apparent by loss of the smooth line corresponding to the nuclear envelope. Cleavage furrow ingression at the onset of cytokinesis in P0 is defined as t = 0, and the time after that is indicated in seconds. Scale bar: 10 μm. (D) Graph reporting the elapsed time ± SEM between AB and P1 cytokinesis (in seconds) in wild-type (N2) (n = 22) and in cdc-7(ok1267) mutants (n = 30). (E) Average ratios ± SEM of the duration of interphase in P1 over the duration of interphase in AB [(IP1)/(IAB)] (RI) in embryos of the indicated genotypes (n = 14). The asterisks indicate that the difference with wild type is statistically significant. See Table S2 for numerical values and statistical analysis. (F) Double cul-2(or209ts); cdc-7(ok1267) mutant analysis. The percentage of embryonic viability of the double cul-2(or209ts); cdc-7(ok1267) mutant was determined in the condition of the cul-2(or209ts) suppressor screen and plotted. The experiment was repeated five times. Asterisk indicates a significant difference (P = 0.011). (G) Western blot analysis of total embryo extracts expressing GFP::CDC-7 compared to the wild type (N2) using an anti-GFP antibody. Arrow indicates the GFP::CDC-7. Asterisk indicates an unspecific band (left panel). Time-lapse spinning disk confocal micrographs of an early embryo expressing GFP::CDC-7 and mCherry::H2B. Scale bar: 10 μm (right panel).

