. 2016 Oct 18;5:e18716. doi: 10.7554/eLife.18716

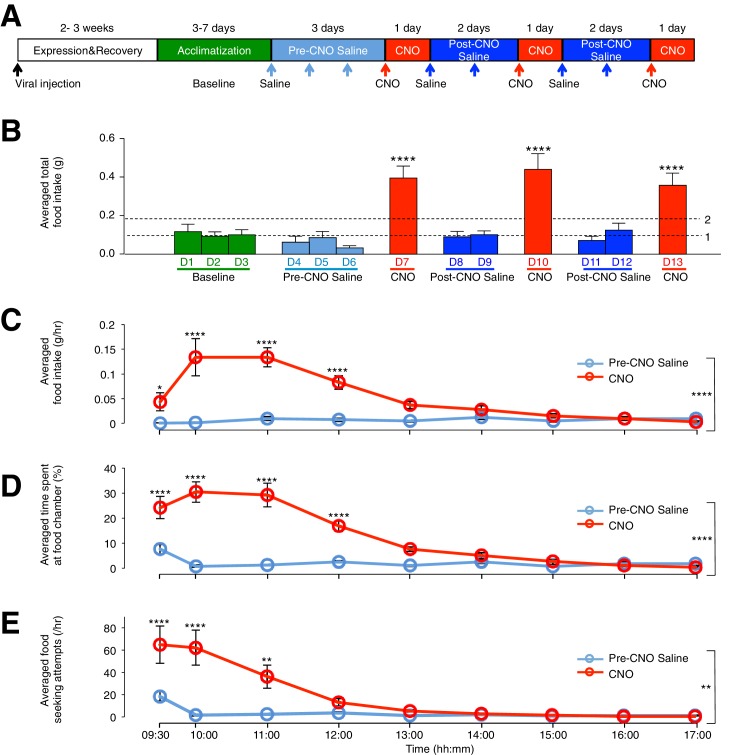
Figure 2. CNO-dependent activation of hM3D(Gq)-mCherry expressing ARC glia evokes increased day food intake, time spent at food chamber and food seeking attempts in C57BL/6 mice.

(A) Schematic of experimental paradigm. The mice were allowed to recover and for hM3D(Gq)-mCherry to be expressed 2–3 weeks post viral injection before acclimatization in custom cages for 3–7 days (baseline) and to saline injection for three days (pre-CNO saline). CNO injections were repeated for three days, each separated by two days of saline injection (post-CNO saline) to allow the CNO effects to clear. All injections were performed at 09:00 while the food intake was measured at specific time points between 09:00–17:00. All mice were housed in custom cages between 09:00–17:00 and returned to the standard cages after 17:00 daily. (B) Total food intake between 09:00–17:00 during baseline, pre-CNO saline, CNO and post-CNO saline averaged across animals. Dotted line 1 refers to the averaged total food intake across baseline, pre- and post- CNO saline while dotted line 2 refers to two folds of this average. (C) Food intake during hourly time points from 09:00 to 17:00 (except from 09:00–09:30 and 09:30–10:00 where 30 min time points were used) during pre-CNO saline and CNO administration. (D) The percentage of time mice spent at food chamber relative to other cage areas during specific time points following pre-CNO saline and CNO administration. (E) The frequency of attempts made to access the food chamber during specific time points following pre-CNO saline and CNO administration. In Figure 2C–E, values between 09:00–09:30 and 09:30–10:00 were normalized to hourly values. Pre-CNO saline and CNO values were averaged across three days of repeats before computing the average across animals. Two-way ANOVA followed by Bonferroni post hoc tests was used. *p<0.05, **p<0.01, ****p<0.0001. Error bars represent SEM. See also Figure 2—figure supplements 16.

DOI: http://dx.doi.org/10.7554/eLife.18716.005

Figure 2.

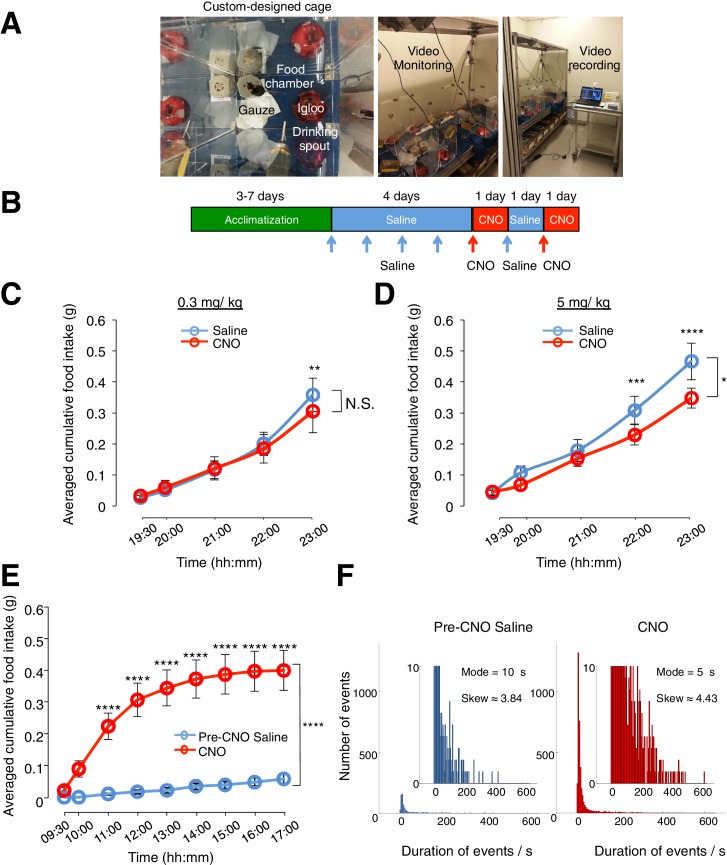
Figure 2—figure supplement 1. CNO administered at 5 mg/kg (but not at 0.3 mg/kg) induces non-specific effects on feeding in animals without DREADD expression. CNO(0.3 mg/kg) evoked robust feeding behavior in animals with hM3D(Gq)-mCherry-expressing ARC glia. .

Figure 2—figure supplement 1.

(A) Setup of custom-designed, open-top cages comprising a food chamber, a drinking spout/water bottle, mouse igloo and sterile gauzes. The mouse igloo was positioned opposite to the food chamber in each cage to serve as an alternative location for rest and play while the animal was not feeding at the food chamber. The bedding was removed and replaced with sterile gauzes to prevent contamination of food in the chamber and therefore ensure accurate measurement of food intake. Video monitoring of the food behavior was enabled with web-cameras positioned above the cages and connected to a laptop for data storage. (BD) Administration of CNO at 5 mg/kg but not 0.3 mg/kg induces non-specific decrease in feeding in C57BL/6 animals without hM3D(Gq)-mCherry expression. (B) Schematic of experimental paradigm. Mice were acclimatized to custom cages before saline injections were performed for four days. CNO injections were repeated for two days, separated by one day of saline injection to allow the CNO effects to clear. All injections were performed at 19:00 while the food intake was measured at specific time points between 19:00–23:00. All mice were housed in custom cages between 19:00–23:00 and returned to the standard cages after 23:00 daily. Cumulative food intake in C57BL/6 animals was assessed from 19:00–23:00 at the specific time points, averaged across five days of saline and two days of CNO before taking the average across animals. (C) Animals were injected with CNO at lower dose (0.3 mg/kg). n = 8 animals, ANOVA, Drug: p>0.5, F (1, 7) = 0.4824; Time: p<0.0001, F (4, 28) = 30.17; Interaction between drug and time: p<0.02, F (4, 28) = 3.481, comparing the population and trial averaged cumulative food intake at specific time points between 19:00–23:00 during saline and CNO administration. (D) Animals were injected with CNO at higher dose (5 mg/kg). n = 7 animals, ANOVA, Drug: p<0.03, F (1, 6) = 8.59; Time: p<0.0001, F (4, 24) = 80.2; Interaction between drug and time: p=0.0005, F (4, 24) = 7.41, comparing the population and trial averaged cumulative food intake at specific time points between 19:00–23:00 during saline and CNO administration. (EF) CNO administration (0.3 mg/kg), when compared to saline administration, induces an increase in food intake, frequency of shorter-duration feeding attempts and maximum duration of feeding episodes in animals with hM3D(Gq)-mCherry-expressing ARC glia. (E) Cumulative food intake from 09:00 to17:00 at the specific time points, averaged across three days of pre-CNO saline and three days of CNO administration before taking the average across animals. n = 11 animals, ANOVA, Drug: p<0.0001, F(2,24) = 19.5; Time: p<0.0001, F(8,192) = 39.2; Interaction between drug and time: p<0.0001, F(16,192) = 21.5, comparing the population and trial averaged cumulative food intake at specific time points between 09:00–17:00 during pre-CNO saline and CNO administration. (F) Frequency histograms of the food-seeking attempts of all animals during pre-CNO saline and CNO administration binned by the duration spent at the food chamber. Following CNO administration, the mode duration of food-seeking events was shorter while the skew of the distribution of duration of attempts tended towards more positive duration values than that following saline administration (p<0.0001, Kolmogorov-Smirnov test, comparing the distribution of durations following saline and CNO administration). In Figure 2—figure supplement 1C–E, two-way ANOVA followed by Bonferroni post hoc tests was used. *p<0.05, **p<0.01, ***p<0.001, ****p<0.0001. N.S., not significant. Error bars represent SEM.
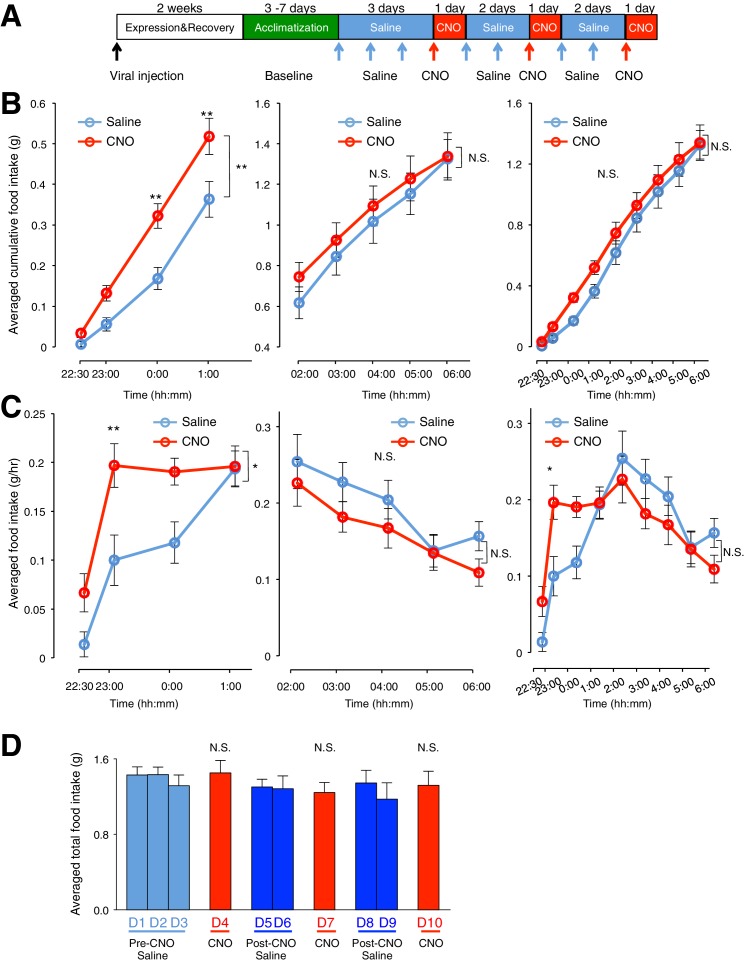
Figure 2—figure supplement 2. Activation of ARC glia evokes increased food intake within 3 hr after CNO application (0.3 mg/kg) but does not increase total food intake in the dark phase.

Figure 2—figure supplement 2.

(A) Schematic of experimental paradigm. Mice were acclimatized to custom cages before saline injections were performed for three days. CNO injections were repeated for three days, separated by two days of saline injection to allow the CNO effects to clear. All injections were performed at 22:00 while the food intake was measured at specific time points between 22:00–06:00. All mice were housed in custom cages between 22:00–06:00 and returned to the standard cages after 06:00 daily. (B) Cumulative food intake from (Left) 22:00–01:00, (Middle) 02:00–06:00 and (Right) 22:00–06:00 at the specific time points, averaged across seven days of saline and three days of CNO before taking the average across animals. n = 6 animals, ANOVA, 22:00–01:00/02:00–06:00/22:00–06:00 - Drug: p=0.0099/0.5852/0.339, F(1,10) = 10.07/ F(1,10) = 0.318/ F(1,10) = 1.01; Time: p<0.0001/ p<0.0001/p<0.0001, F(3,30) = 195.4/F(4,40) = 180/ F(8,80) = 239; Interaction between drug and time: p=0.0036/0.341/0.739, F(3,30) = 5.60/ F(4,40) = 1.16/ F(8,80) = 0.643, comparing the population and trial averaged cumulative food intake at specific time points during saline and CNO administration. (C) Food intake at specific time points from (Left) 22:00–01:00, (Middle) 02:00–06:00 and (Right) 22:00–06:00, averaged across seven days of saline and three days of CNO administration before taking the average across animals. n = 6 animals, ANOVA, 22:00–01:00/02:00–06:00/22:00–06:00 - Drug: p=0.0228/0.150/0.717, F(1,10) = 7.22/ F(1,10) = 2.43/ F(1,10) = 0.139; Time: p<0.0001/ p<0.0001/ p<0.0001, F(3,30) = 38.2/ F(4,40) = 8.21/ F(8,80) = 17.2; Interaction between drug and time: p=0.0266/0.862/0.0007, F(3,30) = 3.53/ F(4,40) = 0.322/ F(8,80) = 3.85, comparing the population and trial averaged food intake at specific time points during saline and CNO administration. Food intake during 22:00–22:30 and 22:30–23:00 were normalized to hourly values. (D) Total food intake between 22:00–06:00 during pre-CNO saline, CNO and post-CNO saline averaged across animals. p>0.3, n = 6 animals, unpaired t-test comparing total food intake during three days of CNO administration with that during three days of pre-CNO saline and four days of post-CNO saline administration. In Figure 2—figure supplement 2B–C, two-way ANOVA followed by Bonferroni post hoc tests was used. *p<0.05, **p<0.05, N.S., not significant. Error bars represent SEM.
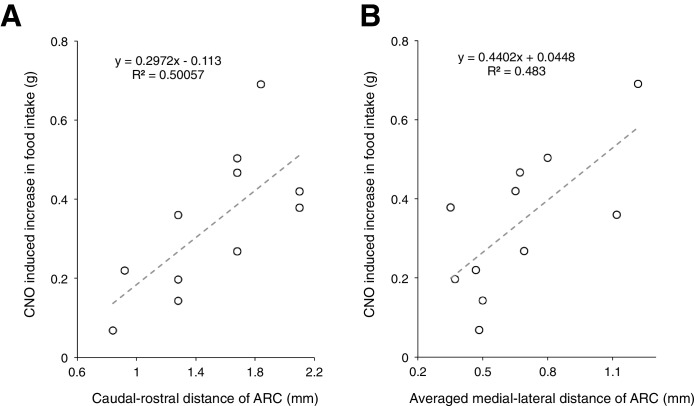
Figure 2—figure supplement 3. Analysis of viral expression showed that mCherry is specifically expressed within the ARC, although there were a few cases where the expression spread into adjacent areas in the hypothalamus.

Figure 2—figure supplement 3.

(AB) A trend where CNO induced greater increase in food intake with increased size of viral expression within the ARC was observed. CNO-induced increase in food intake was computed by taking the averaged total food intake across days with CNO administration subtracted by that across days with saline administration. The size of viral expression is quantified by the spread of viral expression along the (A) caudal-rostral axis and (B) medial-lateral axis of ARC.
Figure 2—figure supplement 4. Administration of CNO (0.3 mg/kg) in mice lacking hM3D(Gq)-mCherry in GFAP-expressing ARC glia does not evoke increased food intake, frequency of feeding attempts and duration of feeding.

Figure 2—figure supplement 4.

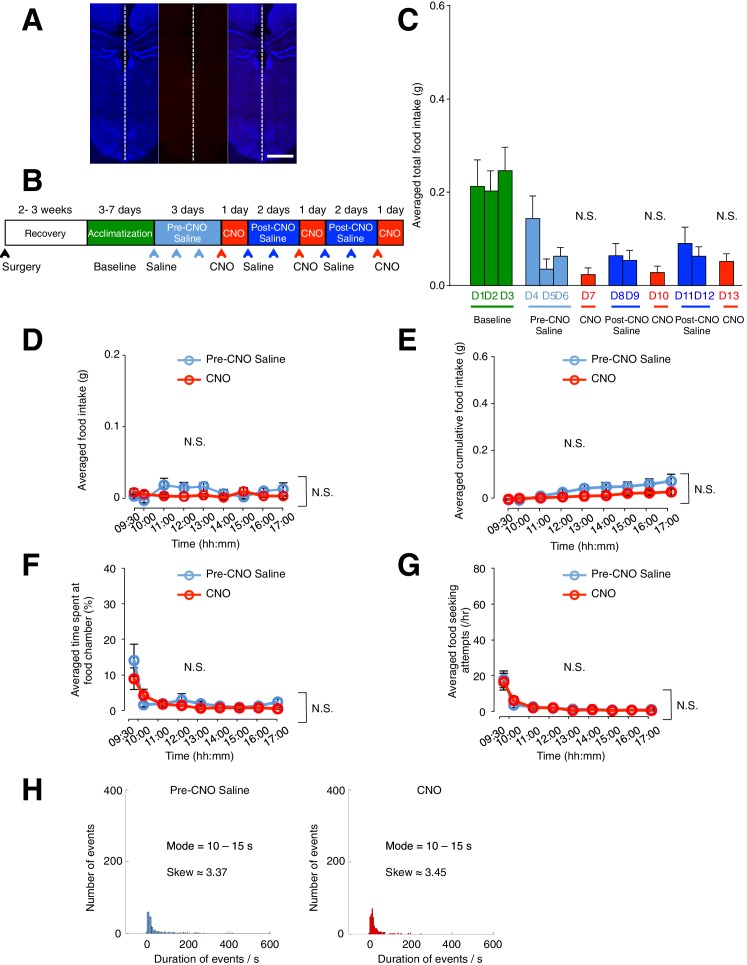
Viral injection of AAV-Gfap-hM3D(Gq)-mCherry was attempted in these animals but failed. All experimental procedures were identical in mice with and without successful viral injection. (A) Example DAPI-stained (blue) coronal brain slice where ARC glia did not express hM3D(Gq)-mCherry. (B) Schematic of experimental paradigm. The mice were allowed to recover after surgery before being acclimatized to custom cages for 3–7 days (baseline) and to saline injection for three days (pre-CNO saline). CNO injections were repeated for three days, each separated by two days of saline injection (post-CNO saline) to allow the CNO effects to clear. All injections were performed at 09:00 while the food intake was measured at specific time points between 09:00–17:00. All mice were housed in custom cages between 09:00–17:00 and returned to the standard cages after 17:00 daily. (C) Total food intake between 09:00–17:00 during baseline, pre-CNO saline, CNO and post-CNO saline averaged across animals. p>0.1, n = 8 animals, unpaired t-test comparing total food intake during three days of CNO administration with that during three days of baseline, three days of pre-CNO saline and 4 days of post-CNO saline administration. (D) Food intake during hourly time points (except from 09:00–09:30 and 09:30–10:00 where 30 min time points were used) averaged across three days of pre-CNO saline and three days of CNO administration before taking the average across animals. n = 8 animals, ANOVA, Drug: p>0.4, F(2,21) = 0.725; Time: p>0.3, F(8,168) = 1.16; Interaction between drug and time: p>0.1, F(16,168) = 1.33, comparing the population and trial averaged food intake at specific time points between 09:00–17:00 during pre-CNO saline and CNO administration. Food intake during 09:00–09:30 and 09:30–10:00 were normalized to hourly values. (E) Cumulative food intake from 09:00 to 17:00 at the specific time points, averaged across three days of pre-CNO saline and three days of CNO before taking the average across animals. n = 8 animals, ANOVA, Drug: p>0.3, F(2,21) = 1.08; Time: p<0.0001, F(8,168) = 17.8; Interaction between drug and time: p>0.2, F(16,168) = 1.29, comparing the population and trial averaged cumulative food intake at specific time points between 09:00–17:00 during pre-CNO saline and CNO administration. (F) The percentage of time mice spent at food chamber relative to other cage areas during specific time points averaged across three days of pre-CNO saline or three days of CNO before taking the average across animals. n = 8 animals, ANOVA, Drug: p>0.3, F(1,14) = 1.03; Time: p<0.0001, F(8,112) = 11.0; Interaction between drug and time: p>0.4, F(8,112) = 0.971, comparing the population and trial averaged percentage of time spent at specific time points between 09:00–17:00 during pre-CNO saline and CNO administration. (G) The frequency of attempts made to access the food chamber during specific time points averaged across three days of pre-CNO saline or three days of CNO before computing the average across animals. Values between 09:00–09:30 and 09:30–10:00 were normalized to hourly values. n = 8 animals, ANOVA, Drug: p>0.9, F(1,14) = 0.00391; Time: p<0.0001, F(8,112) = 20.6; Interaction between drug and time: p>0.9, F(8,112) = 0.203, comparing the population and trial averaged frequency of attempts at specific time points between 09:00–17:00 during pre-CNO saline and CNO administration. In Figure 2—figure supplement 4D–G, two-way ANOVA followed by Bonferroni post hoc tests was used. (H) Frequency histograms of food-seeking attempts of all animals during pre-CNO saline and CNO administration binned by the duration spent at the food chamber. p>0.1, Kolmogorov-Smirnov test, comparing the distribution of durations during saline and CNO administration. N.S., not significant. Error bars represent SEM.
Figure 2—figure supplement 5. Administration of CNO (0.3 mg/kg) in control mice with mCherry-expressing ARC glia does not evoke increased food intake.

Figure 2—figure supplement 5.

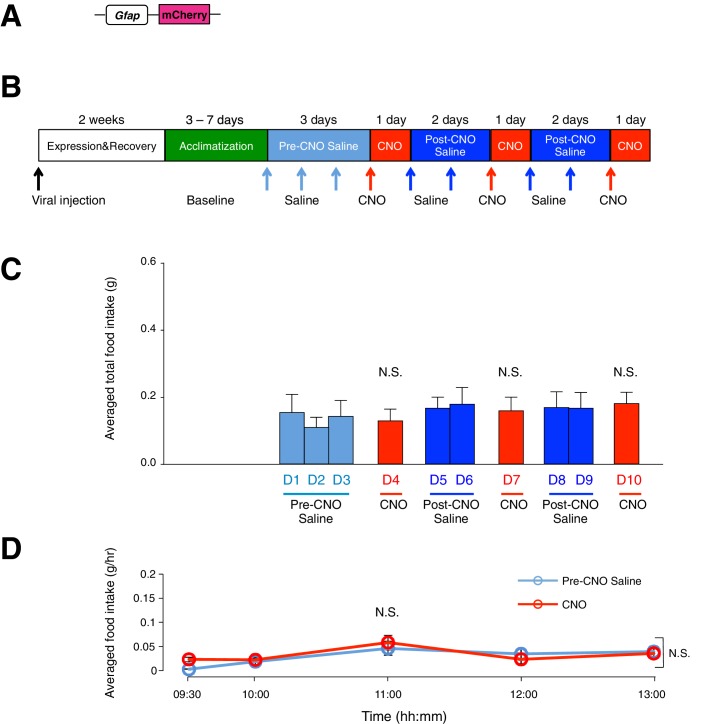
(A) Design of the AAV construct expressing mCherry under the Gfap promoter. (B) Schematic of experimental paradigm. The mice were allowed to recover after surgery before being acclimatized to custom cages for three days (baseline) and to saline injection for three days (pre-CNO saline). CNO injections were repeated for three days, each separated by two days of saline injection (post-CNO saline) to allow the CNO effects to clear. All injections were performed at 09:00 while the food intake was measured at specific time points between 09:00–13:00. All mice were housed in custom cages between 09:00–13:00 and returned to the standard cages after 13:00 daily. (C) Total food intake between 09:00–13:00 during pre-CNO saline, CNO and post-CNO saline averaged across animals. p>0.5, n = 7 animals, unpaired t-test comparing total food intake during three days of CNO administration with that during seven days of saline administration. (D) Food intake during hourly time points (except from 09:00–09:30 and 09:30–10:00 where 30 min time points were used) averaged across three days of pre-CNO saline and three days of CNO before taking the average across animals. n = 7 animals, ANOVA, Drug: p=0.701, F(1,12) = 0.154; Time: p<0.0001, F(4,48) = 8.90; Interaction between drug and time: p=0.225, F(4,48) = 1.47, comparing the population and trial averaged food intake at specific time points between 09:00–13:00 during pre-CNO saline and CNO administration. Food intake during 09:00–09:30 and 09:30–10:00 were normalized to hourly values. Two-way ANOVA followed by Bonferroni post hoc tests was used. N.S., not significant. Error bars represent SEM.
Figure 2—figure supplement 6. DREADD activation of glia does not lead to changes in body weight.

Figure 2—figure supplement 6.

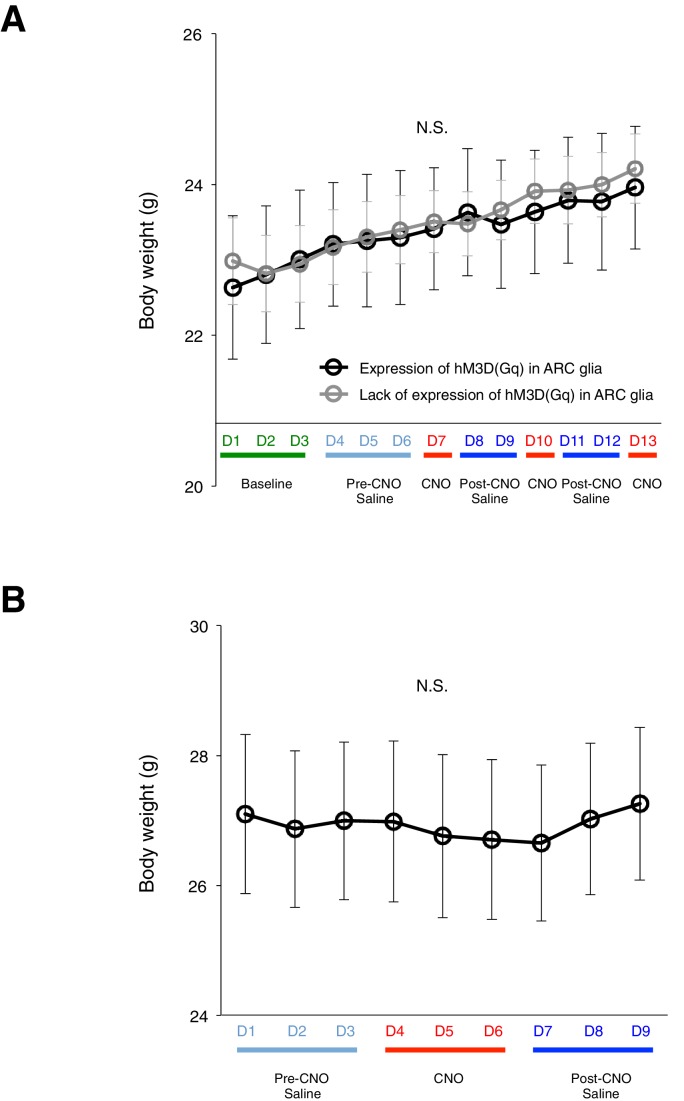
(A) Averaged body weight across animals with (black, n = 5 animals) or without (grey, n = 8 animals) expression of hM3D(Gq)-mCherry in ARC glia. Injections of CNO or saline were performed once a day at 09:00 (ANOVA, Without and with expression: p>0.9, F(1,11) = 0.0160; Time: p<0.0001, F(12,132) = 18.2; Interaction: p>0.8, F(12,132) = 0.578, comparing the population averaged body weight without and with hM3D(Gq)-mCherry expression. Two-way ANOVA followed by Bonferroni post hoc tests was used. (B) Averaged body weight across animals with expression of hM3D(Gq)-mCherry in ARC glia. Injections of CNO or saline were performed twice a day at 09:00 and 17:00. n = 8 animals, p>0.06, paired t-test comparing body weight measured during days of pre-CNO saline and CNO injections. N.S., not significant. Error bars represent SEM.