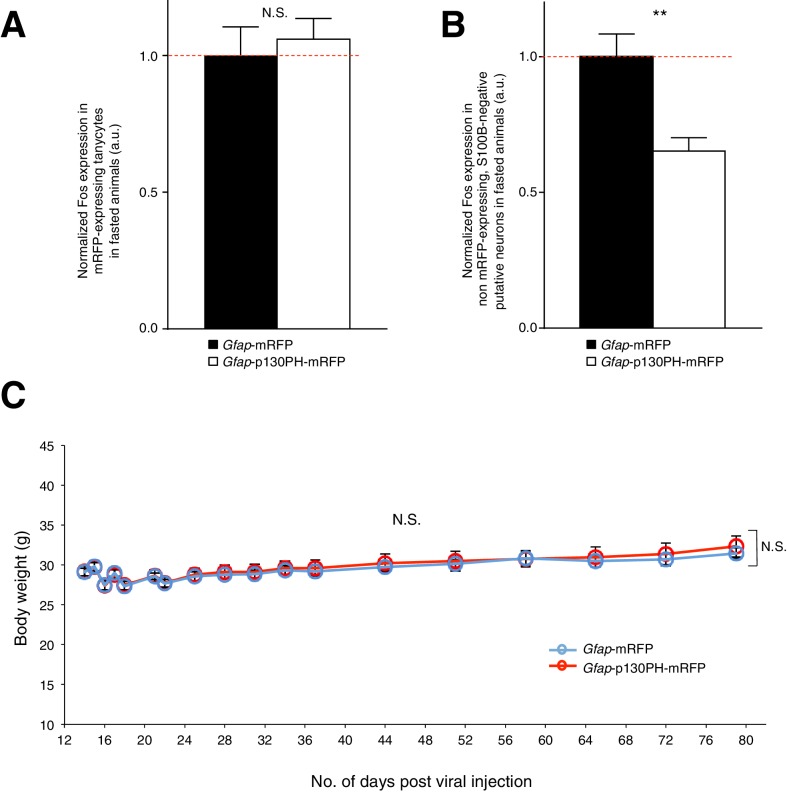
(A) Fos immunoreactivity in mRFP-expressing tanycytes is not significantly different in fasted animals injected with AAV-Gfap-p130PH-mRFP than in control animals injected with AAV-Gfap-mRFP. Animals were perfused for Fos quantification 16–18 hr post initiation of fasting. Population mean of normalized Fos expression in ARC tanycytes of AAV-Gfap-p130PH-mRFP and AAV-Gfap-mRFP injected animals. p130PH: n = 22 tanycytes in 8 animals, Control: n = 24 tanycytes in 8 animals, p=0.651, unpaired t-test, comparing averaged responses across tanycytes in AAV-Gfap-p130PH-mRFP and AAV-Gfap-mRFP injected animals. (B) Fos immunoreactivity in non mRFP-expressing, S100B-negative ARC putative neurons is lower in fasted animals injected with AAV-Gfap-p130PH-mRFP than in control animals injected with AAV-Gfap-mRFP. Population mean of normalized Fos expression in ARC putative neurons of AAV-Gfap-p130PH-mRFP and AAV-Gfap-mRFP injected animals. p130PH: n = 718 putative neurons in 8 animals, Control: n = 600 putative neurons in 8 animals, p=0.0030, unpaired t-test, comparing averaged responses across putative neurons in AAV-Gfap-p130PH-mRFP and AAV-Gfap-mRFP injected animals. (C) Averaged body weight across AAV-Gfap-p130PH-mRFP (red, n = 8 animals) and AAV-Gfap-mRFP (blue, n = 8 animals) injected animals, measured after viral injection surgery. ANOVA, Gfap-p130PH-mRFP and Gfap-mRFP: p=0.805, F(1,14) = 0.0630; Days: p<0.0001, F(17,238) = 32.6; Interaction: p=0.980, F(17,238) = 0.420, comparing the population averaged body weight of AAV-Gfap-p130PH-mRFP and AAV-Gfap-mRFP injected animals. Two-way ANOVA followed by Bonferroni post hoc tests was used. **p<0.01, N.S., not significant. Error bars represent SEM.


