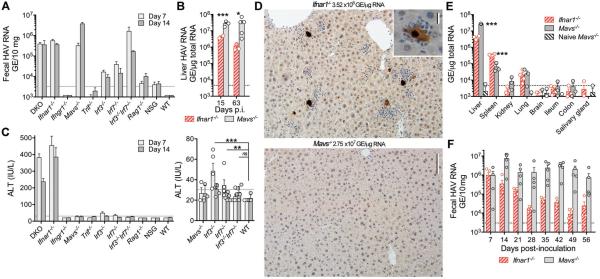
Figure 2.
HAV infection in Ifnar1−/− vs. Mavs−/− mice. (A) Fecal HAV RNA on day 7 and 14 after i.v. challenge of different genetically-deficient mice. Data are mean ± SEM, n=3-5. (B) Viral RNA in livers of Ifnar1−/− vs. Mavs−/− mice 15 and 63 d.p.i. Data are mean ± SEM, n=2–5 as shown. *p<0.05, ***p<0.001 by two-sided t test. (C) Serum ALT 7 and 14 d.p.i. in genetically-deficient mice, with expanded low ALT range on the right. Data are mean ± SEM, n= 5. **p<0.01, ***p<0.001 for combined day 7 and 15 data by two-sided Mann-Whitney test. (D) Immunohistochemical staining of cleaved caspase 3 in liver from representative (top) Ifnar1−/− vs. (bottom) Mavs−/− mice 15 d.p.i. Bar = 100μm (inset, 12.5μm). (E) Tissue distribution of HAV RNA in infected Ifnar1−/− vs. Mavs−/− mice. Data are mean ± SEM, n=3–4. ***p<0.001 by multiple t-test with false discovery rate 1%. (F) Fecal virus shedding in infected Ifnar1−/− or Mavs−/− mice over 56 days of infection. Data are mean ± SEM, n=3-5. ***p<0.001 by multiple t-test with false discovery rate 1%.

