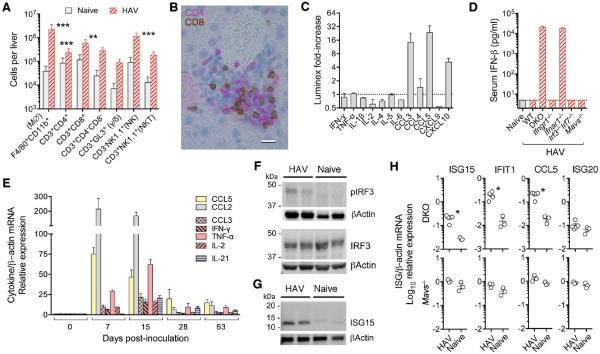
Figure 3.
Cellular and cytokine response to HAV infection in DKO and Ifnar1−/− mice. (A) Estimated intrahepatic leukocyte numbers in naïve versus infected Ifnar1−/− mice 7 d.p.i. Data are mean ± SD, n=5 (mean ALT=372 IU/L). **p<0.01, ***p<0.001 by two-way ANOVA with Tukey's multiple comparison test. (B) Dual immunohistochemical staining of infected Ifnar1−/− liver for CD4 (magenta) and CD8 (brown) showing a mixed cellular infiltrate14 d.p.i. Bar = 10 μm. (C) Fold-increase in liver cytokine levels in HAV-infected DKO mice (Luminex assay) with ALT >200 IU/L. Mean ± range, n=2. (D) Serum IFNβ measured by ELISA 7 d.p.i. Data are mean ± SD, n=4. (E) Fold-increase in intrahepatic cytokine and chemokine mRNA abundance in Ifnar1−/− mice. Data are mean ± SEM, n=4–5. Immunoblots of (F) phospho-Ser-396 and total IRF3, and (G) ISG15 in livers from HAV-infected vs. naïve DKO mice. β-actin included as a loading control. (H) Intrahepatic transcripts of IRF3-regulated ISGs, ISG15, IFIT1 (ISG56), CCL5 (RANTES), and ISG20 (not directly regulated by IRF3), in HAV-infected DKO (n=4) and Mavs−/− (n=3) mice vs. naïve animals 18–28 d.p.i. *p<0.05 by t test.

