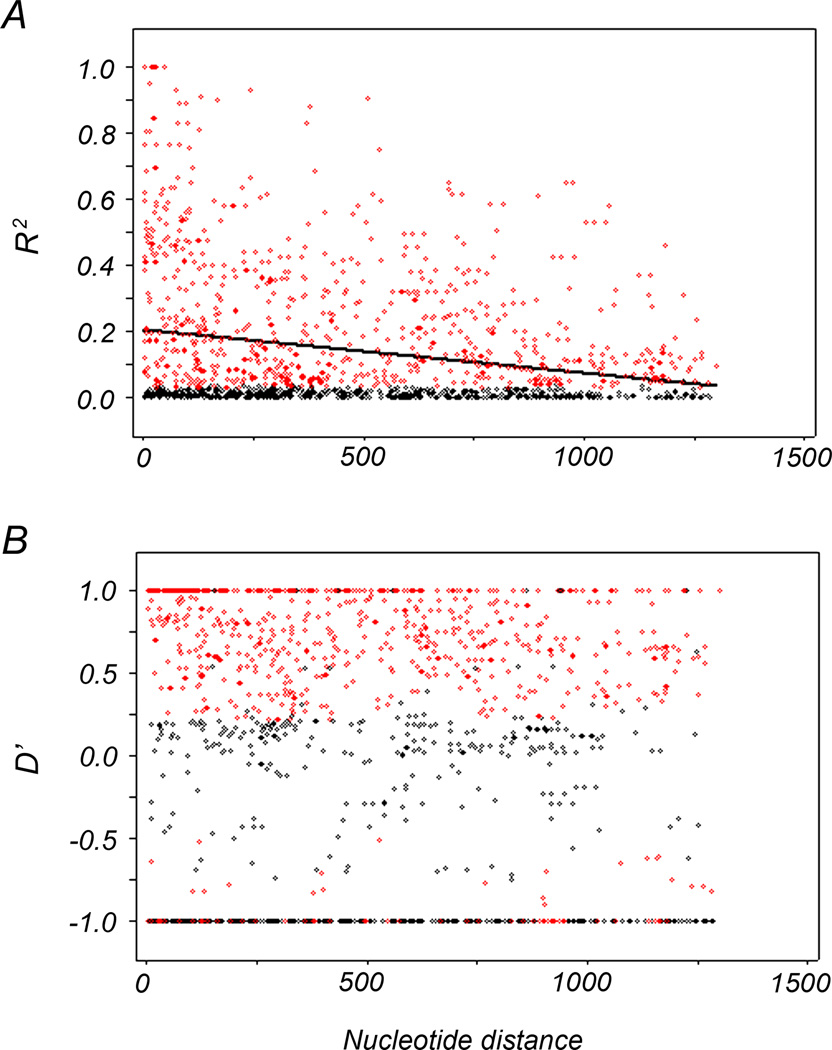
Fig. 2.
Linkage disequilibrium (LD) across the PfAMA1 gene of China-Myanmar border isolates was calculated by using the (A) R2 and (B) D’ index. Those pairs of sites that show significant linkage disequilibrium as calculated by Fisher’s exact test is shown as red circles, while all others are shown by black circles. Trace line represents the regression line.

