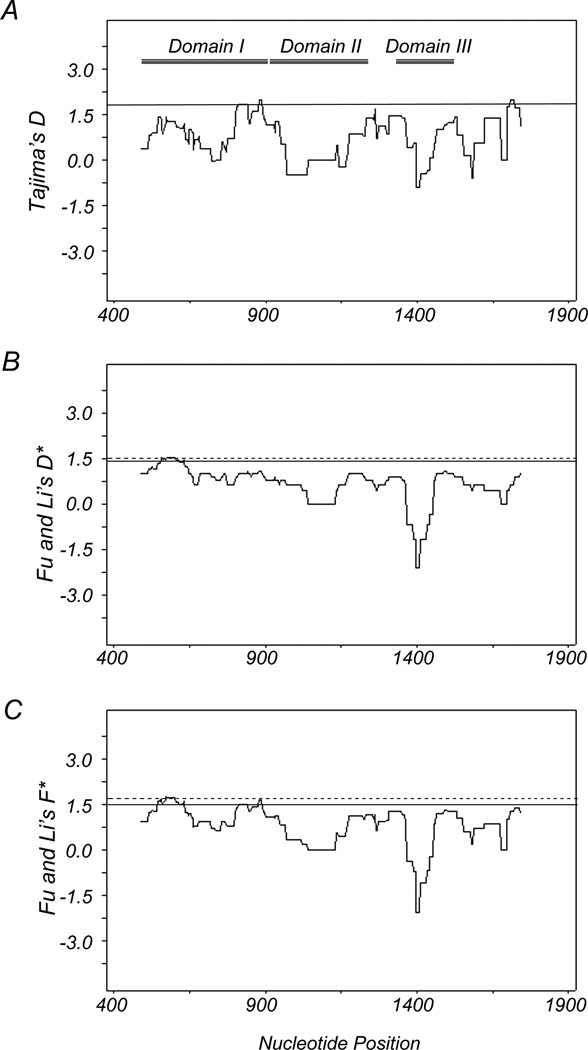
Fig. 3.
Sliding window plot of Tajima’s D test (A), Fu and Li’s D* (B) and F* (C) tests for PfAMA1 isolates from China-Myanmar border area. Nucleotide numbers are those of 3D7. Window length is 90 bp, and step size is 3 bp. The three domains of AMA1 are represented within the first plot as lines labeled Domain I, Domain II, and Domain III, respectively. Regions outside of the dash lines indicate the region with a significant departure from neutrality (P< 0.05, one-tailed). Regions outside the solid lines indicate regions with positive values (P< 0.1, one-tailed).

