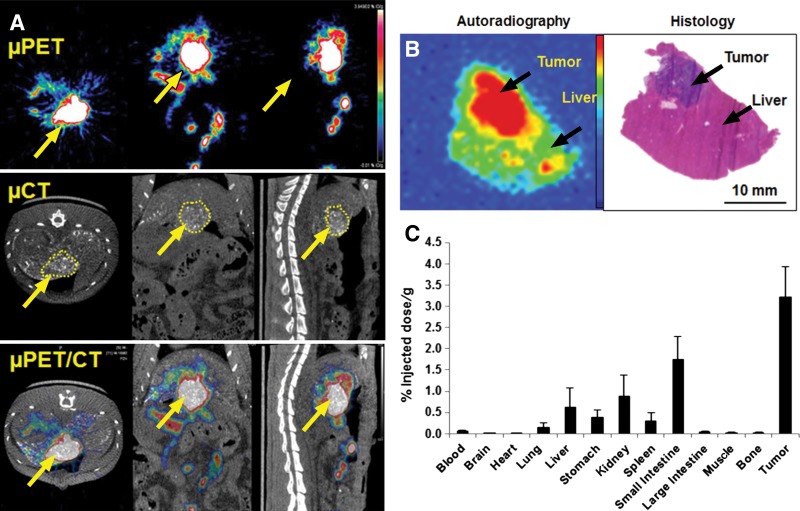
Figure 5:
Micro-PET/CT (μPET/CT) images and biodistribution of PEG-[64Cu]-HAuNS after intrahepatic arterial injection with CA4P. A, Areas of high radioactivity in N1S1 tumors (yellow arrows) on micro-PET images matched the contrast-enhanced regions on corresponding micro-CT images. B, Representative autoradiograph and microphotograph of hematoxylin and eosin–stained tumor and normal liver tissue. C, Bar graph shows biodistribution of PEG-[64Cu]-HAuNS 1 hour after intrahepatic arterial injection after CA4P. Data are means ± standard deviation (n = 5).

