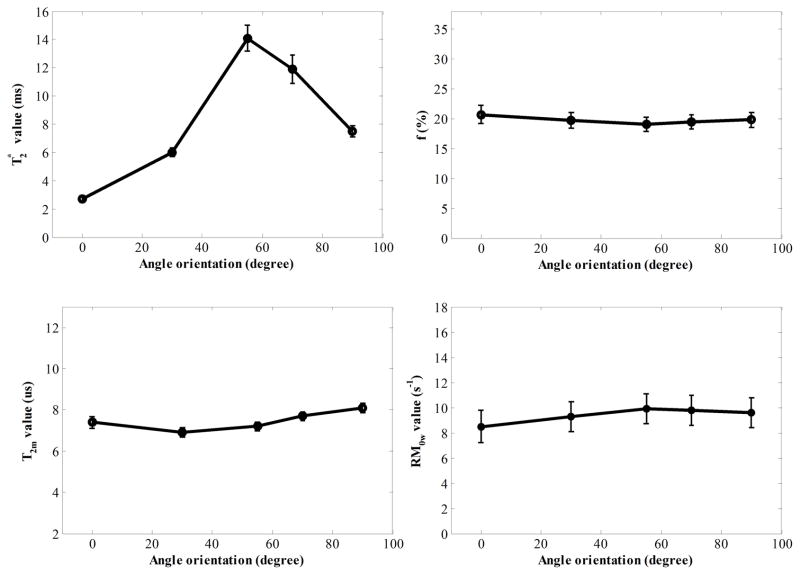
Figure 3.
Graphes of T2* values derived by fitting multiple-TE data and macromolecular proton fractions (f), T2 value of macromolecular proton (T2m) and exchange rate from macromolecular proton to water proton (RM0w) derived from two-pool MT modeling with five angle orientations between fiber direction F⃗ and B⃗0. Fitting errors of these parameters were shown by error bars.

