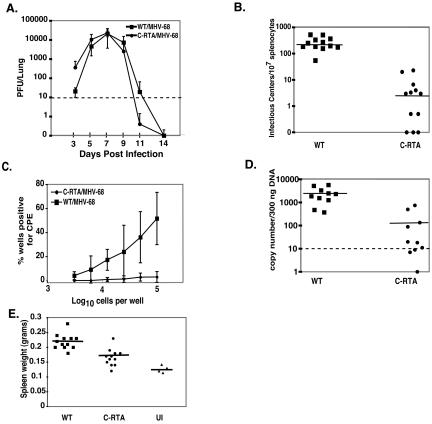
FIG. 3.
In vivo characterization of C-RTA/MHV-68. (A) In vivo replication kinetics of C-RTA/MHV-68 and WT/MHV-68. The data are compiled from six mice per time point. Dotted line, detection limit of the assay. (B) Infectious center assay comparing C-RTA/MHV-68-infected mice and WT/MHV-68-infected mice. Solid line, average values of the mice in each group. (C) Ex vivo limiting dilution reactivation assay comparing C-RTA/MHV-68 infected mice and WT/MHV-68 infected mice. (D) Real-time PCR quantitation of viral genomes in C-RTA/MHV-68-infected mice and WT/MHV-68-infected mice. Dotted line, detection limit of the assay; solid line, average values of the mice in each group. (E) Quantitation of spleen size in C-RTA/MHV-68-infected mice, WT/MHV-68-infected mice, and uninfected (UI) mice. Solid line, average values of the mice in each group. The statistical difference between the values for C-RTA/MHV-68-infected mice and WT/MHV-68 infected mice in the assays in panels B to E was P < 0.0001. All of the data in panels B to E were compiled from two independent experiments consisting of a total of 10 to 12 mice per virus.

