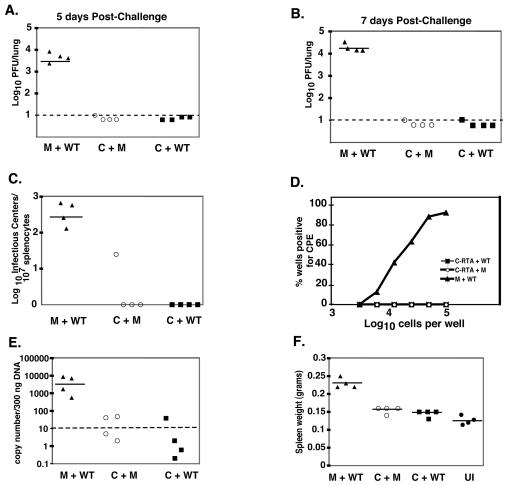
FIG. 4.
Vaccination with C-RTA/MHV-68 prevents acute viral infection and establishment of latency. Viral titer in the lungs of C-RTA/MHV-68-infected mice or mock-infected mice at 5 (A) and 7 (B) days postchallenge. The statistical difference between values for mock-infected and C-RTA/MHV-68-infected mice that were challenged was P < 0.0001 for both time points. Dotted line, limit of detection of the assay. (C) Infectious center assay comparing C-RTA/MHV-68-infected mice and mock-infected mice 20 days postchallenge. The statistical difference between values for mock-infected and C-RTA/MHV-68-infected mice that were challenged was P = 0.0003. (D) Ex vivo limiting dilution assay performed on the splenocytes 20 days postchallenge. The statistical difference between mock-infected and C-RTA/MHV-68-infected mice that were challenged was P = 0.0003. (E) Real-time PCR quantitation of viral genomes in the splenocytes. Solid line, the average of the values of the mice in each group. The statistical difference between the values for the mock-infected and C-RTA/MHV-68-infected mice that were challenged was P = 0.0001. (F) Quantitation of spleen size in the mice 20 days postchallenge and in uninfected mice. The statistical difference between the values for the mock-infected and C-RTA/MHV-68-infected mice that were challenged was P < 0.0001. For panels A to F, there were four mice per group, and the solid lines indicate the averages of the values of the mice in each group. M+WT, mock-infected mice challenged with WT/MHV-68; C+M, C-RTA/MHV-68-infected mice and mock challenge; C+WT, C-RTA/MHV-68-infected mice challenged with WT/MHV-68; UI, uninfected mice.

