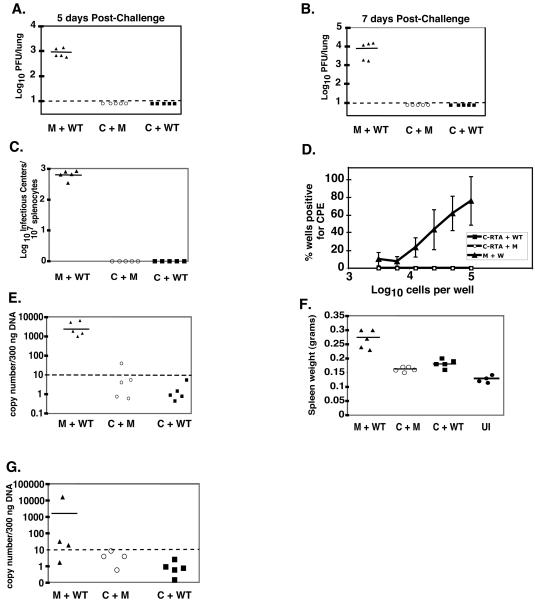
FIG. 5.
WT/MHV-68 challenge 90 days post-primary infection. Viral titer in lungs of C-RTA/MHV-68-infected mice or mock-infected mice at 5 (A) and 7 (B) days postchallenge. The statistical difference between the values for mock-infected and C-RTA/MHV-68-infected mice that were challenged was P < 0.0001 for both time points. Dotted line, the limit of detection of the assay. (C) Infectious center assay comparing C-RTA/MHV-68-infected mice and mock-infected mice 20 days postchallenge. The statistical difference between the values for mock-infected and C-RTA/MHV-68-infected mice that were challenged was P < 0.0001. (D) Ex vivo limiting dilution assay performed on the splenocytes 20 days postchallenge. The statistical difference between the values for mock-infected and C-RTA/MHV-68-infected mice that were challenged was P < 0.0001. (E) Real-time PCR quantitation of viral genomes in the splenocytes. The statistical difference between the values for the mock-infected and C-RTA/MHV-68-infected mice that were challenged was P < 0.0001. (F) Quantitation of spleen size in the mice 20 days postchallenge and in uninfected mice. The statistical difference between the values for mock-infected and C-RTA/MHV-68-infected mice that were challenged was P = 0.001. For panels A to F, there were five mice per group, and the solid lines indicate the averages of the values of the mice in each group. (G) Real-time PCR quantitation of viral genomes in splenocytes of mice 2 months postchallenge. The statistical difference between the values for the mock-infected and C-RTA/MHV-68-infected mice that were challenged was P = 0.05. M+WT, mock-infected mice challenged with WT/MHV-68; C+M, C-RTA/MHV-68-infected mice and mock challenge; C+WT, C-RTA/MHV-68-infected mice challenged with WT/MHV-68; UI, uninfected mice.

