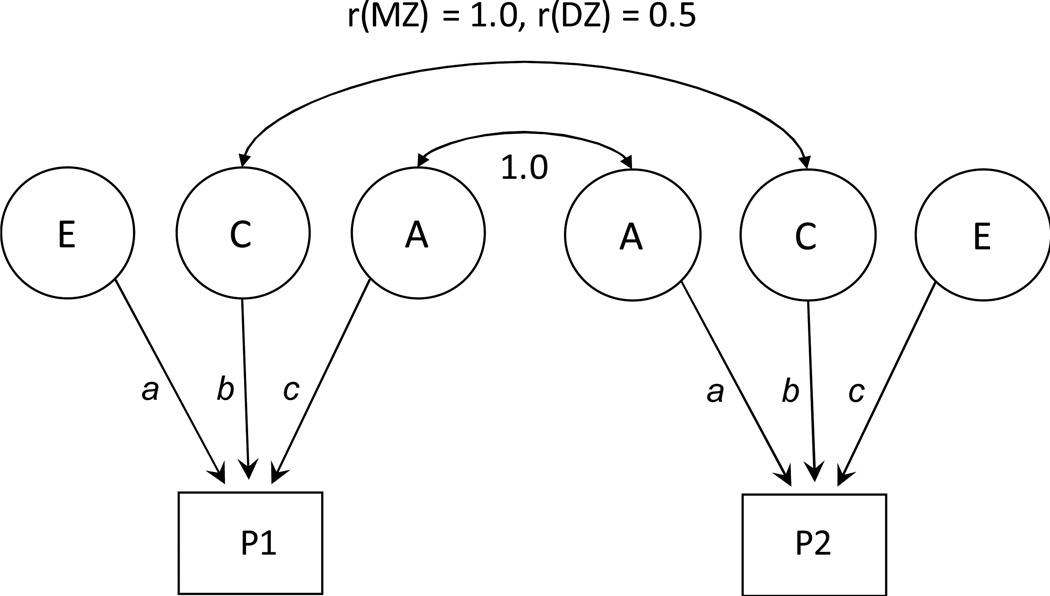
Figure 1.
Path diagram of the classic twin design. The twin model decomposes phenotypic variance into genetic and environmental components in monozygotic (MZ) and dizygotic (DZ) twins. P1 represents the phenotype for the first twin and P2 the phenotype for the second twin. Circles represent latent factors hypothesized to account for individual differences: A= additive genetic influences, C= common, or shared, environmental influences, E = non-shared, or unique, environmental influences. Curved, double-headed arrows represent the correlation between twins.

