Figure 3.
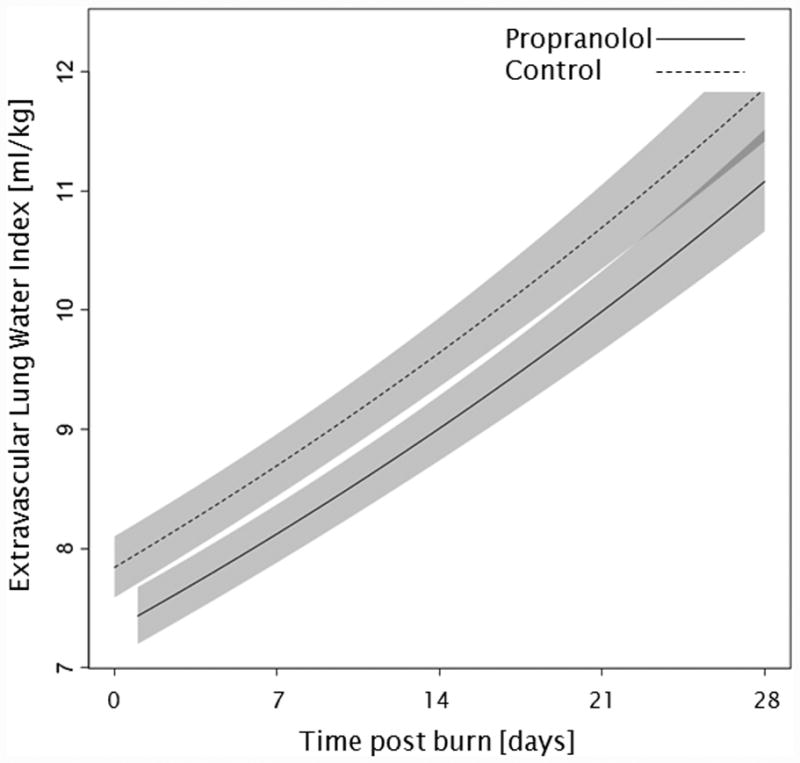
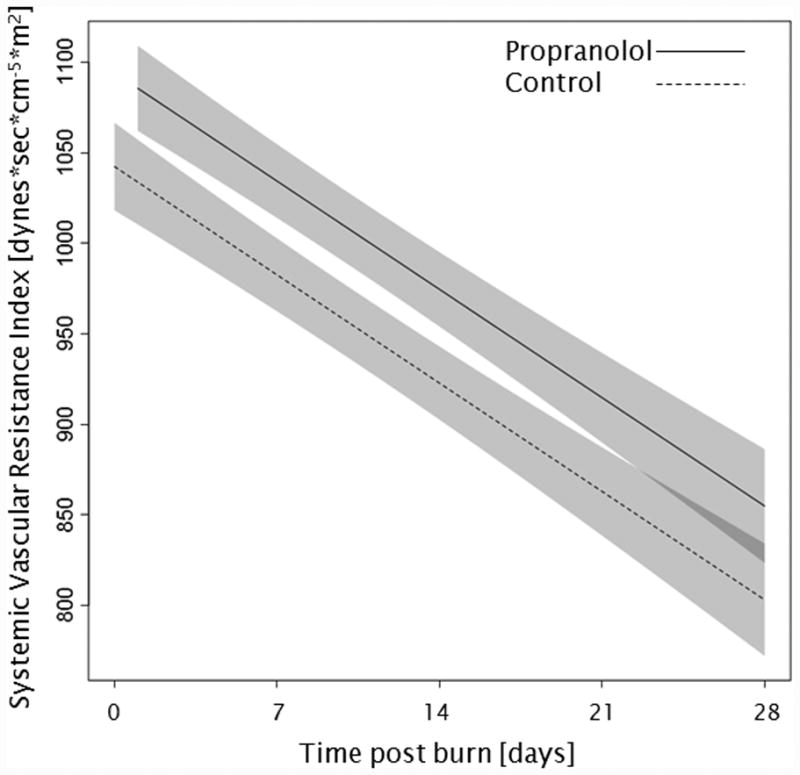
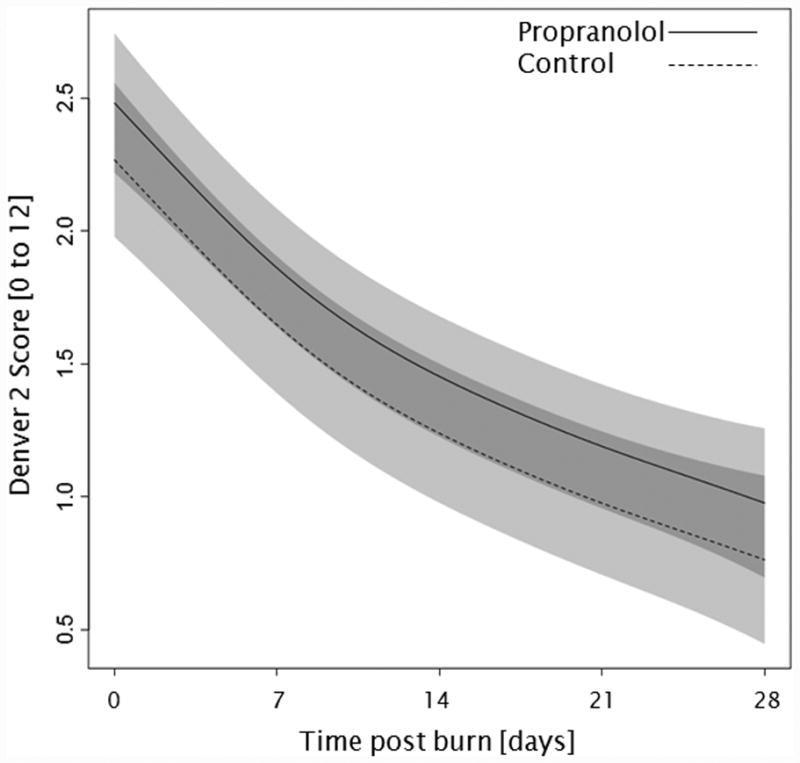
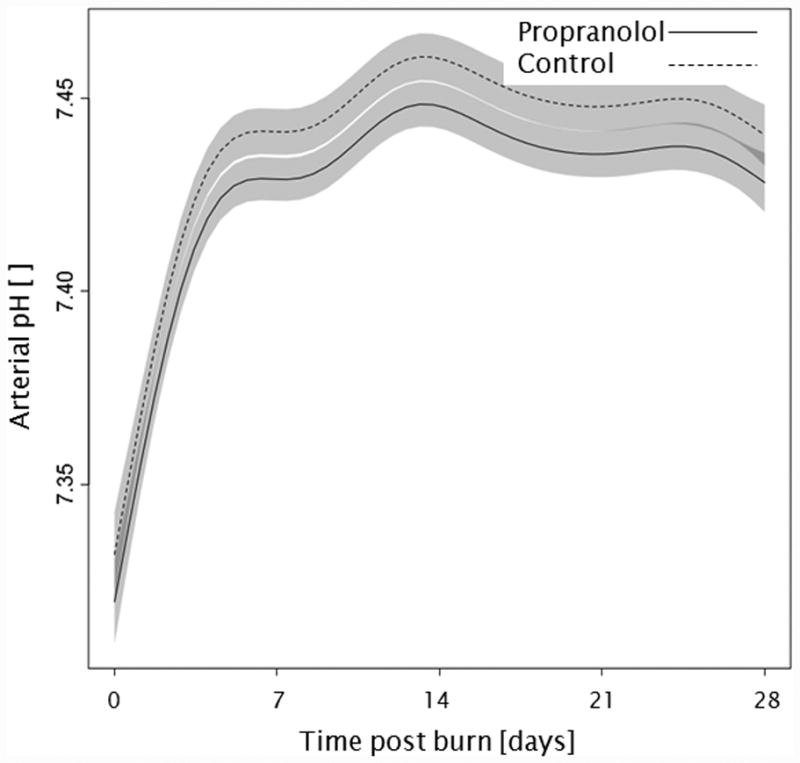
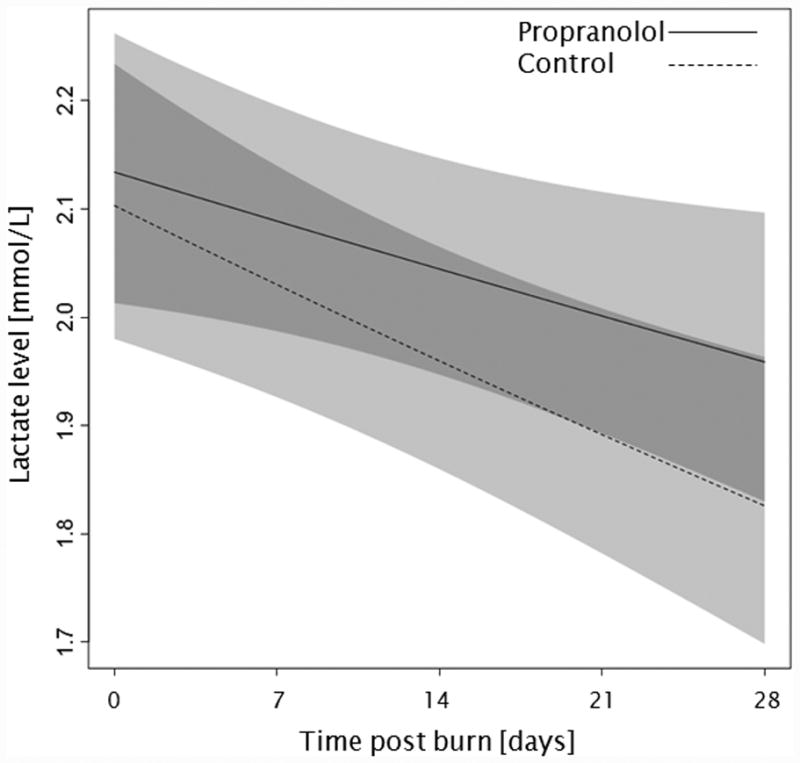
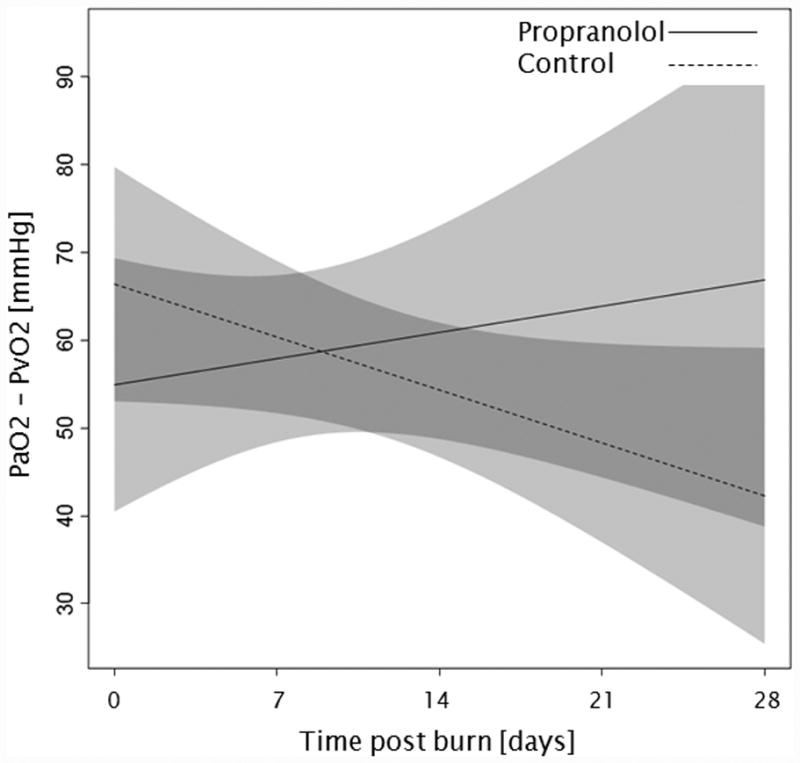
Trends for (A) extravascular lung water index, (B) systemic vascular resistance index, (C) Denver 2 score, (D) arterial pH, (E) lactate levels, and (F) PaO2-PvO2 over 28 days post burn. Lines show the regression model estimate over time post burn with 95% shaded confidence intervals.
