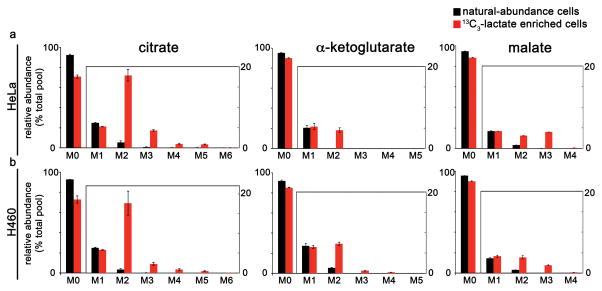
Figure 2.
HeLa and H460 cells cultured in 13C3-lactate have labeled TCA cycle intermediates. The patterns shown represent the isotopologue distribution of citrate, α-ketoglutarate, and malate as measured by LC/MS. Data are from (a) HeLa cells or (b) H460 lung cancer cells cultured for 3 hours in standard media (containing natural-abundance glucose) that was supplemented with either 3 mM 13C3-lactate (red) or natural-abundance lactate (black). Data shown are mean values ± s.d. (n = 3).

