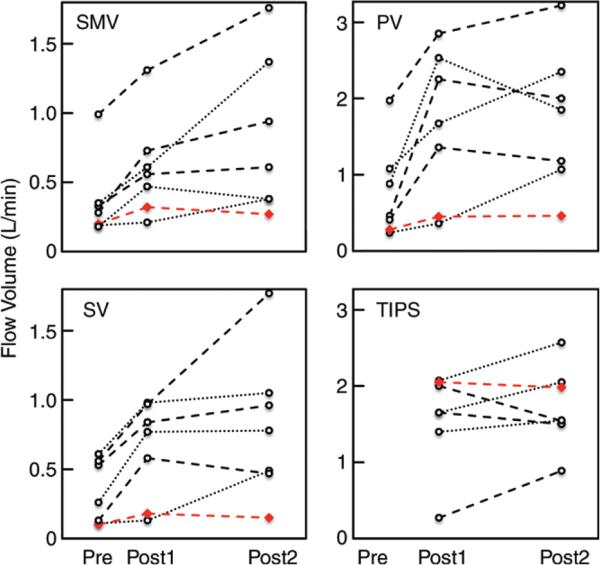
Figure 3.
Graphs show quantitative analysis of blood flow volumes before (pre), 2 weeks after (post 1), and 12 weeks after (post 2) TIPS placement. Flow volumes were quantified in the SMV (top left), PV (top right), SV (bottom left), and TIPS stent (bottom right). Red line = patient with refractory ascites after TIPS placement.

