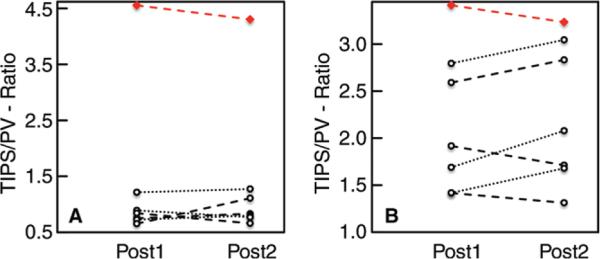
Figure 4.
Ratio of peak velocity and flow volume in TIPS stent versus the PV. A, Graph shows the TIPS-to-PV ratio of peak velocity, which varied among the seven included patients. The highest ratio was observed in the patient with refractory ascites after TIPS placement (red line). B, Graph shows the TIPS-to-PV-ratio of flow volume in six of seven patients 2 (post 1; average, 0.8 ± 0.2) and 12 (post 2; average, 0.9 ± 0.2) weeks after TIPS placement. A higher flow volume ratio (4.6:4.3) was detected in the patient with refractory ascites after TIPS placement (red line).

