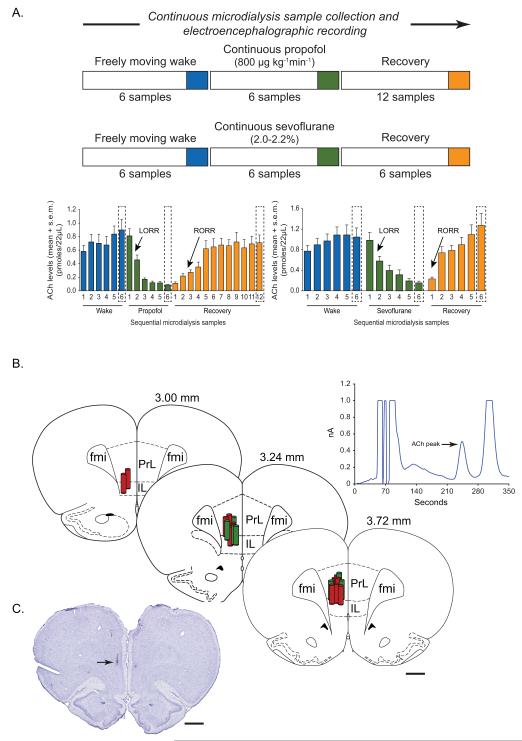
Figure 1.
A) Schematic illustrating the design for microdialysis experiments and temporal course of electroencephalogram and acetylcholine (ACh) data collection. Each ACh sample epoch represents microdialysate collected over a period of 12.5 min. The electroencephalographic data were analyzed in the corresponding 12.5 min epochs. Blue, green and orange bars represent wake, anesthetic-induced unconsciousness (propofol/sevoflurane), and post-anesthetic recovery wake epochs, respectively. The epochs highlighted with broken lines were selected for statistical comparisons. Arrows indicate the approximate time points at which rats showed loss of righting reflex (LORR) and recovery of righting reflex (RORR). B) Reconstruction diagram shows a cascade of coronal brain section drawings from the rat brain atlas27 to illustrate the location (vertical cylinders) of microdialysis probes (1 mm) within the prefrontal cortex. Green cylinders represent the microdialysis probes from the propofol experiments while the red cylinders represent those from the sevoflurane experiments. Numbers above the coronal brain section drawings are the anterior-posterior stereotaxic coordinates relative to Bregma. The chromatogram above the reconstruction diagram shows signal to noise ratio and the retention time for ACh. C) Cresyl violet stained representative coronal brain section through prefrontal cortex shows the dialysis probe track and the site of microdialysis. Arrow indicates the location of ventral tip of the microdialysis membrane. fmi - forceps minor corpus callosum, IL - infralimbic area, PrL - prelimbic area. Scale bar - 1 mm.

