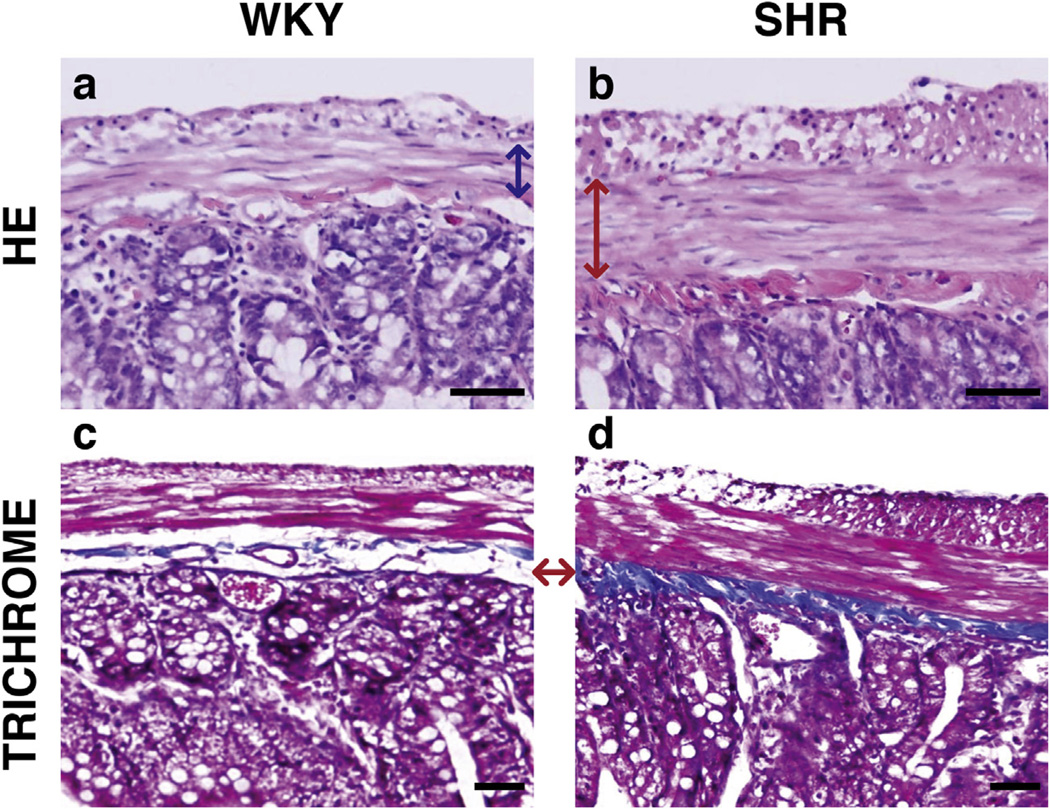
Fig. 8.
Representative transverse slices show an increase in smooth muscle proliferation and collagen deposition in SHR samples. Hematoxylin and Eosin staining (top row) shows thickened smooth muscle cell layer in the SHR (red arrow, 8b) from the WKY normotensive control (blue arrow, 8a). Trichrome stains (bottom row) show increased collagen deposition in the SHR sample (8d) in the submucosa layer than in the WKY sample (8c). The red arrow shows the corresponding layers in each sample, where the dense blue layer in the SHR sample is indicative of a higher density of collagen. Scale bars are 50 µm; serosa is featured at the top of each image.

