Figure 3.
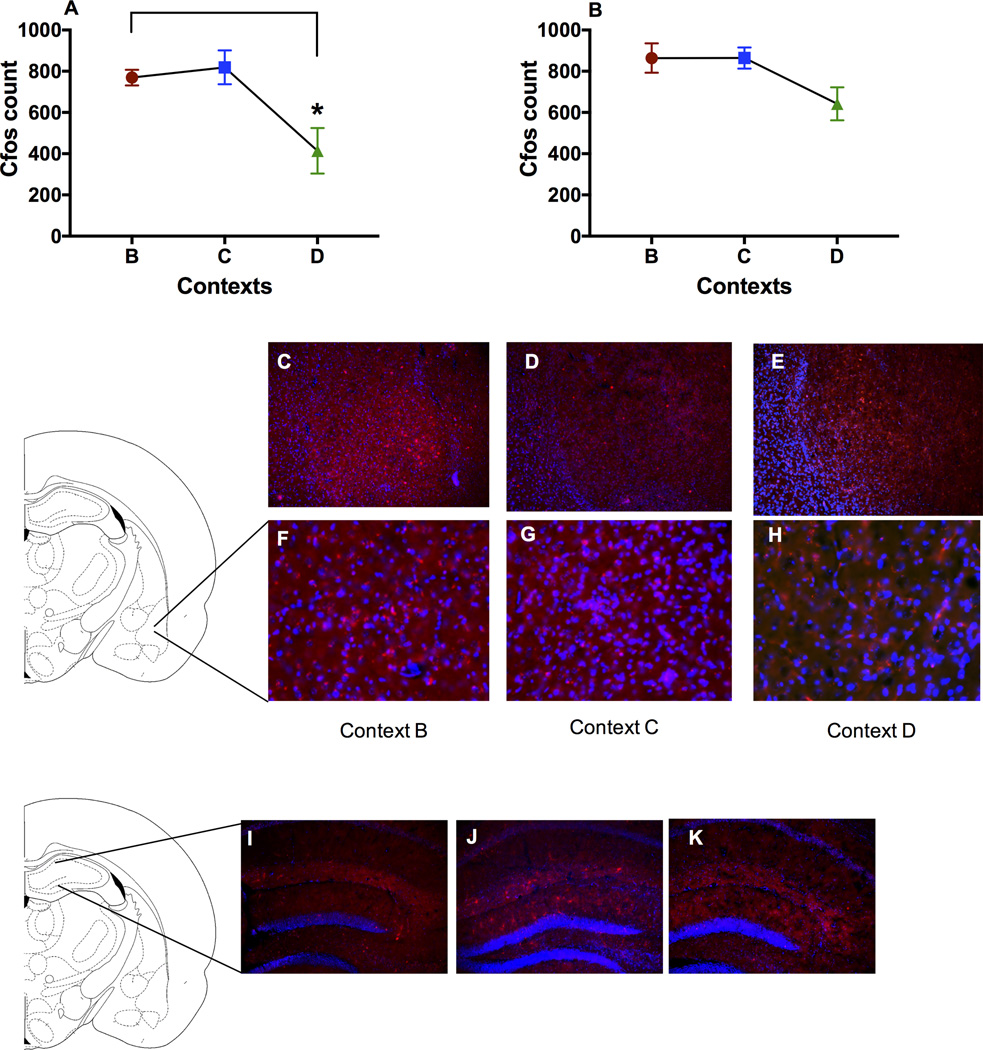
Level of immunoreactivity of cfos positive cells in the BLA and hippocampus of the groups tested in context B, C and D in BLA and hippocampus. A) *Post-hoc analysis revealed that cfos level in context B was significantly higher than in context D in the BLA (P<0.05). B) No difference was found in the level of cfos in the hippocampus. C–H) Representative photomicrographs showing cfos immunoreactivity in the BLA. Top panel (C, D, E) showing BLA at a 10× magnification and bottom insets showing higher magnification images. I–K) Representative photomicrographs showing cfos in the hippocampus.

