
Fig. 2.
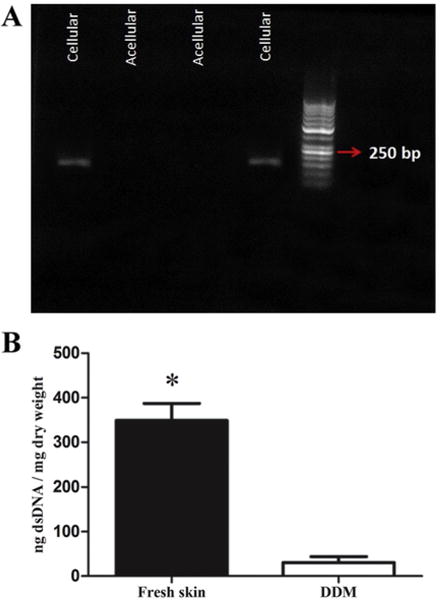
The effect of decellularization process on DNA content. (A) The PCR fragments in the fresh skin and DDM scaffolds identified by agarose gel electrophoresis. The red arrow shows the 250 kb band in the standard ladder. The PCR analysis illustrated that the samples had no detectable copies of β-actin. (B) The dsDNA concentration of the fresh skin and DDM were determined by using a Quanti-iT PicroGreen® dsDNA assay. The dsDNA concentration significantly decreased in the DDM scaffolds after processing (*P<0.001). Points are means ± SD. (For interpretation of the references to colour in this figure legend, the reader is referred to the web version of this article.)