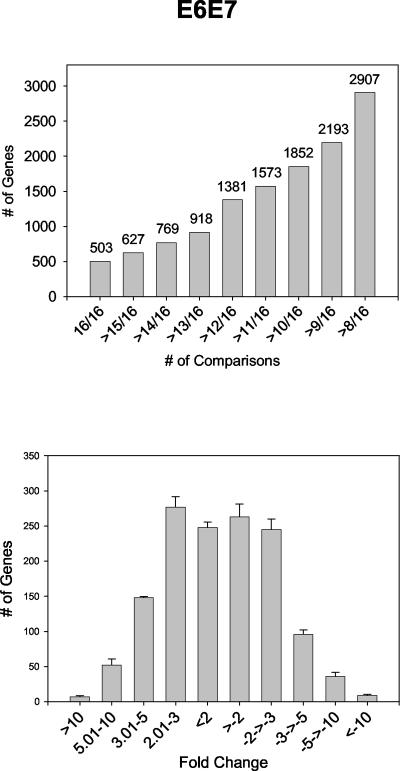
FIG. 3.
Histograms depicting numbers of reproducible transcript changes versus total number of comparisons (top). The 1,381 genes that were found altered in ≥12 of 16 comparisons were selected for further analysis. Histograms on the bottom show the distribution of 1,381 transcripts, altered in ≥12 of 16 comparisons, according to fold change.

