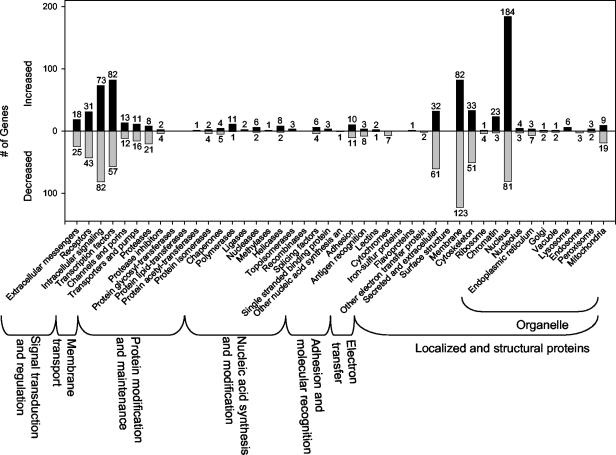
FIG. 4.
Incyte functional hierarchies of transcripts reproduced in ≥12 of 16 comparisons. This and the following figure are meant to provide an overall view of transcript changes. Note that because increased/decreased genes may appear multiple times within these hierarchies, the number of genes provided in this and the following figure is relative, not absolute.

