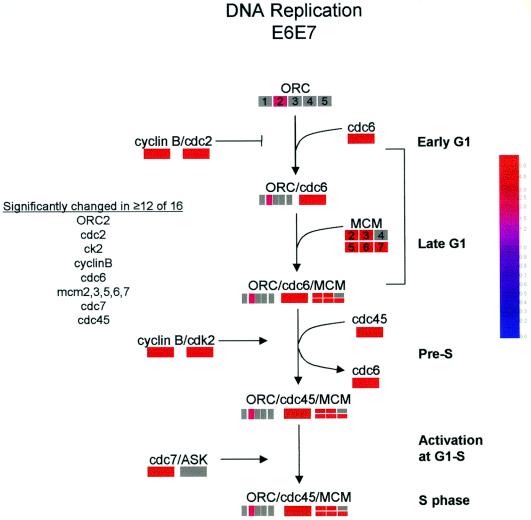
FIG. 6.
Changes in transcripts associated with the DNA synthesis pathway. A grey bar indicates that gene did not achieve reproducibility in ≥12 of 16 comparisons. The colored bars indicate the fold difference relative to controls (see inset) of transcripts that were reproducibly changed in ≥12 of 16 comparisons.

