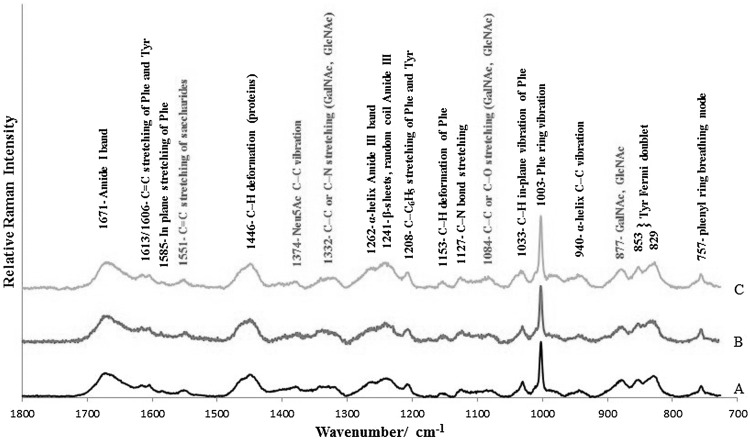
Fig. 1.
Unique Raman spectra of EBN samples collected from different geographical locations. A Kuantan, West Malaysia (black line), B Kuching, East Malaysia (red line), C Jakarta, Indonesia (orange line). The band assignments attributed to peptides are shown in black, and those that are attributed to saccharides are shown in red (color figure online)

