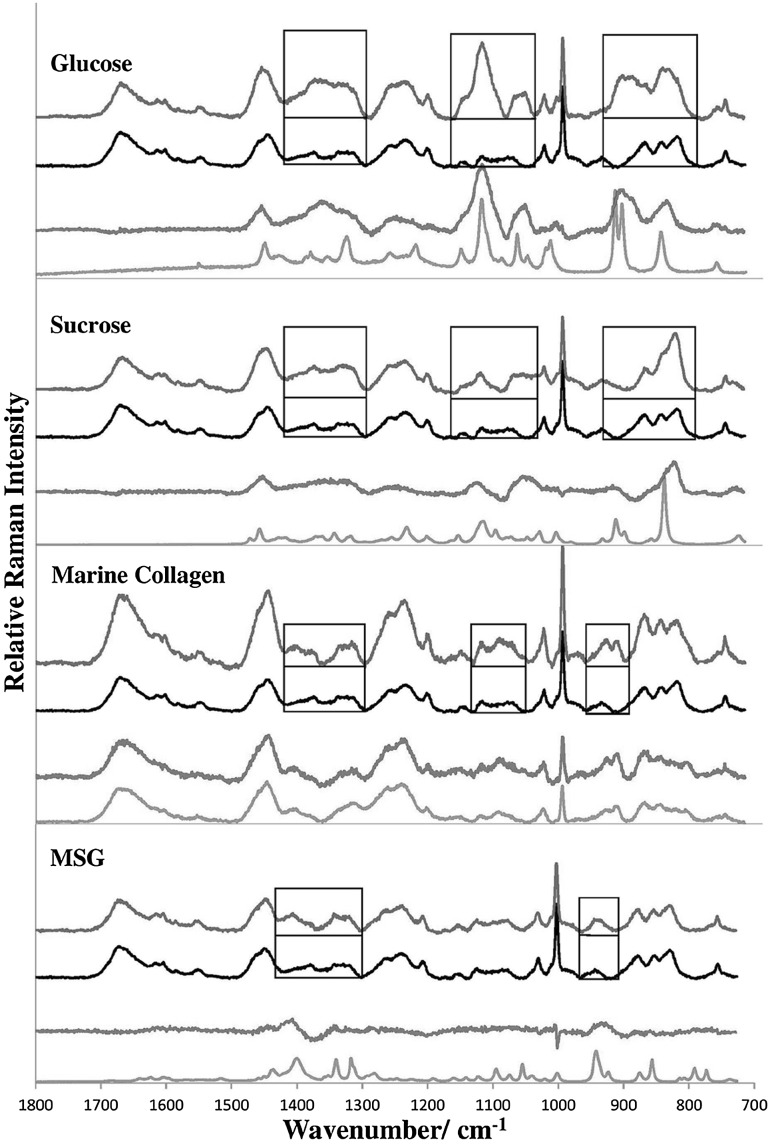
Fig. 3.
Comparison of Raman spectra of EBN adulterated with Type II adulterants (blue line) unadulterated EBN (black line), the difference spectra (red line) and the pure adulterant (green line). The adulterants, from top to bottom, are glucose, sucrose, hydrolyzed marine collagen and monosodium glutamate (MSG). The rectangular boxes show the spectral regions where the adulterated EBN differ from the unadulterated EBN in lineshape and intensity, and they are due to the additional Raman scattering of the adsorbed adulterant (color figure online)

