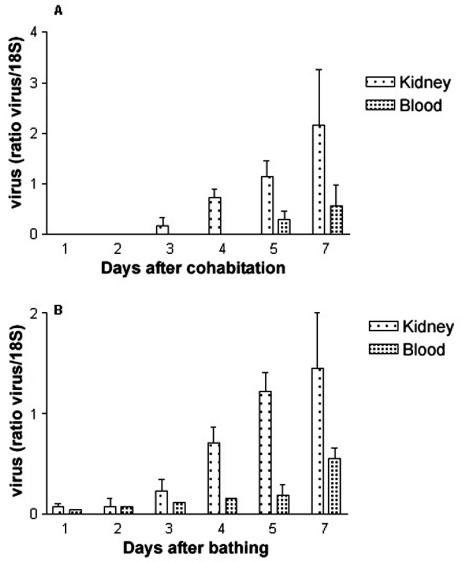
FIG. 3.
Kinetics of the appearance of viral DNA in infected fish. Semiquantitative PCR analysis of CNGV DNA was performed on DNA extracted from fish blood samples or kidneys following infection by cohabitation (A) or bathing (B). The CNGV DNA levels are normalized against those of 18S ribosomal DNA in the same sample. Each bar represents the mean for five fish ± standard error of the mean.

