Abstract
The purpose of this study is to perform quantitative measurement based on the standardized uptake value (SUV) of the uptake of Tc-99m methylene diphosphonate (MDP) in the normal vertebrae using a single photon emission tomography (SPECT)/computed tomography (CT) scanner. A retrospective study of patients with cancer or joint disorders was performed. We acquired data for a group of 29 patients (8 women and 21 men; mean age, 68.2 ± 6.7 years; age range, 44-87 years) undergoing bone SPECT/CT scans with Tc-99m MDP between September and October 2015. Various SUVs were calculated based on body-weight, lean-body-weight (lbw), Japanese lean-body-weight (jlbw) and Japanese bone-mineral-content (jbmc). SUVs of normal vertebrae showed a wide range of values. Among these, the maximum body-weight based SUV showed the lowest coefficient of variation. The SUVs also showed relatively small intra-subject variability. In addition, all SUVs showed moderate and significant correlation with height. Moreover, lbw-, jlbw-, and jbmc-based SUVs of men were significantly higher than those of women. In conclusions, SUVs of normal vertebrae showed a relatively large inter-individual variability and small intra-individual variability. As a quantitative imaging biomarker, SUVs might require standardization with adequate reference data for the same subject to minimize variability.
Keywords: SUV, bone, SPECT, SPECT/CT, QIBA
Introduction
Over the last quarter of a century, Tc-99m-labeled bone scintigraphic agents such as methylene diphosphonate (MDP) and hydroxymethylene diphosphonate (HMDP) have been widely used for bone scintigraphy in cases of metastatic bone disease, Paget’s disease, fractures in osteoporosis, and other similar conditions [1-4]. The diphosphonates bind to the calcium-rich tissue and the mineral phase of bone hydroxyapatite [5,6]. Planar imaging has been mainly performed for bone scintigraphy, and single-photon emission computed tomography (SPECT) has been occasionally performed for a limited range of the body. However, quantitative analyses have not been usually performed for bone scans because of the lack of appropriate calculation methods. Recently, a scanner combining SPECT and computed tomography (CT) has gained widespread acceptance. These scanners provide fusion images of CT and SPECT and also produce attenuation correction maps that are necessary for quantitative analyses using the standardized uptake value (SUV) [7]. SUV is defined as the tissue concentration of tracer as measured by a scanner divided by the activity injected divided usually by body weight. This value has been widely used for analyses in F-18 fluorodeoxyglucose (FDG) positron emission tomography (PET). Recently, SUV measurements of bone imaging using F-18 NaF PET have been reported to have potential as a diagnostic tool [8]. However, to our knowledge, few reports have been published on SUV measurement in bone imaging using SPECT/CT scans with Tc-99m-labeled bone scintigraphic agents. The primary aim of this study was to report the SUV of normal vertebrae with absolute values, deviation, and intra- and inter-individual variability.
Methods
Patients
In this study, we retrospectively analyzed the data of patients who underwent bone scans. Patient data analysis was carried out with permission from the Ethics Committee of our institution. Informed consent from patients was obtained for research use of image data. We acquired data for a group of 29 patients (8 women and 21 men; mean age, 68.2 ± 6.7 years; age range, 44-87 years) undergoing Tc-99m MDP (FUJIFILM RI Pharma Co., Ltd, Tokyo, Japan) bone SPECT/CT between September and October 2015. The injected activity of Tc-99m ranged from 638 to 826 MBq (mean, 755 ± 38 MBq) (17.2-22.3 mCi; mean, 20.4 ± 1.0 mCi) corresponding to 0.21 to 19.8 MBq/kg (mean, 13.0 ± 2.3 MBq/kg) (7.9 to 0.54 mCi/kg; mean, 0.35 ± 0.06 mCi/kg). Planar and SPECT/CT images were acquired about 3-4 h after intravenous injection. The area (chest or abdomen) of SPECT/CT acquisition was determined based on the patient’s disease or the purpose of the examination.
The patients in our group were included based on the following criteria:
• Access to data on measured injection activity, time of measurement, and time of injection.
• Access to patient’s weight and height information.
• SPECT/CT scans for thoracic or lumbar vertebrae .
• Absence of diffuse bone metastases.
Based on patient records, all patients were examined for staging malignancy, such as prostate cancer (n = 12), renal cancer (7), breast cancer (3), bladder cancer (2), ureter cancer, lung cancer, bladder cancer, colon cancer, and ovarian cancer.
Data acquisition and reconstruction
We used the Symbia® T16 (CT with a maximum of 16 slice acquisitions per rotation, Siemens Healthcare, Molecular Imaging, Hoffman Estates, IL, USA) system for SPECT/CT scans. The SPECT scans were acquired using low-energy high-resolution collimation, a 128 × 128 matrix of 4.8-mm pixel size, and a total of 450 s/rotation in a continuous-rotation mode. Subsequent to the SPECT acquisition, a low-dose CT scan was acquired with 130 kV and 15 ref mAs using adaptive dose modulation (CARE Dose 4D; Siemens Healthcare [9]). The CT data were generated with a 5-mm slice thickness using a smooth reconstruction kernel (B08s, Siemens Healthcare) and a 2-mm slice thickness using a medium kernel (B60s medium sharp, Siemens Healthcare).
SPECT reconstruction was performed using Flash3D (Siemens Healthcare, Molecular Imaging) [10]. Flash3D is an ordered subset expectation maximization (OSEM) reconstruction algorithm with depth-dependent 3D (axial and trans-axial) resolution recovery, scatter correction using scatter window subtraction (dual-energy window approach), and attenuation correction based on attenuation maps derived from the CT data filtered with the B08s kernel. The OSEM SPECT reconstruction used four subsets and eight iterations without post-smoothing.
Data analysis
From the vertebral bodies scanned, all vertebrae exhibiting any focal SPECT or CT pathology, such as osteophyte, metastasis, and compression fracture, were excluded from the analysis based on the diagnosis defined by a board-certified radiologist. Overall, SUVs of 189 vertebrae were calculated for analyses based on the criteria previously defined.
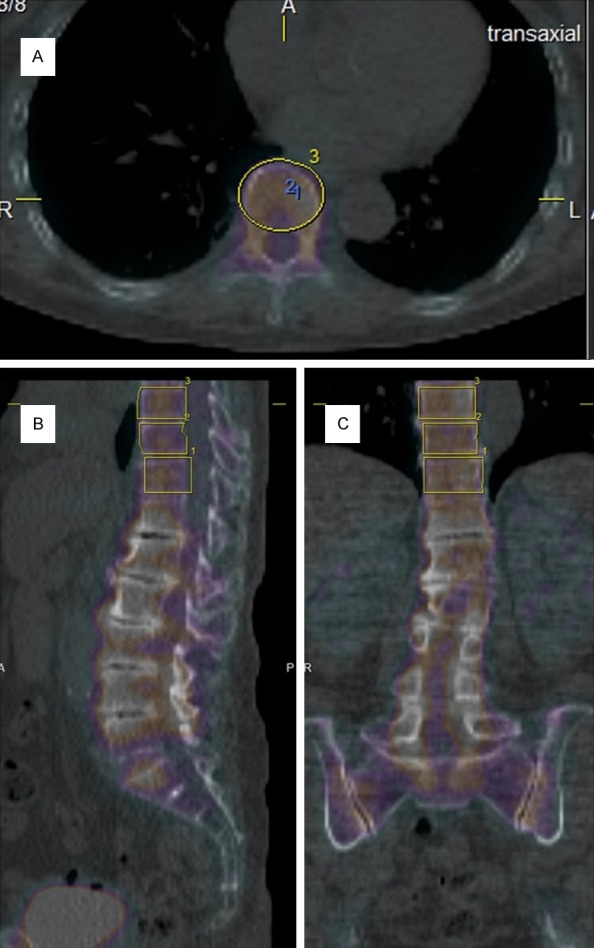
The delineation of the volumes of interest (VOIs) was performed by a board-certified radiologist using a newly released software “G-I bone” provided by Nihon Medi-Physics Co., Ltd. (Tokyo, Japan), which reports the statistics for the various SUVs, such as max, peak, min, and mean SUV. Cylinder-shaped VOIs that covered the complete vertebral body were hand-drawn. Figure 1 shows a representative patient’s fused data set in transverse and coronal planes with their respective VOIs.
Figure 1.

Transaxial (A), saggital (B) and coronal (C) images of a patient’s SPECT/CT fused data sets including the three lower vertebrae. The ellipses depict the VOIs selected. Notice that vertebrae under Th12 were excluded for analyses because of degenerative changes.
The SPECT/CT system was calibrated with a uniform phantom, which provides a volume sensitivity factor and is specific to the camera type, collimator type, and the window energy settings used. The patient’s reconstructed values were then normalized with volume sensitivity. All data were decay-corrected to the time of injection in order to control fluctuations at the start time of the acquisition. Final values of quantitative tracer concentrations were thus defined with respect to injection time.
Body weight (bw), lean body weight (lbw), Japanese lean body weight (jlbw), and Japanese bone mineral content (jbmc) based on the following equations were used to calculate SUV normalization variations, namely SUVbw, SUVlbw, SUVjlbw, and SUVbone. The maximum, peak, and mean SUV were calculated using SUVbw, and described as SUVmax, SUVpeak, and SUVmean. The SUVpeak is an average SUV with a spheric VOI (12-mm diameter) positioned so as to maximize the enclosed average activity. SUVlbw, SUVjlbw, and SUVbone were calculated using SUVmax.
The jlbw and jbmc were derived from healthy Japanese adult subjects (n = 2411) using dual-energy X-ray absorptiometry (DEXA) [11] as follows:
Male lbw (kg) = 28.27 × height (m) + 0.359 × weight (kg) - 0.032 × age (y) - 21.83
Female lbw (kg) = 26.12 × height (m) + 0.253 × weight (kg) - 0.022 × age (y) - 19.58
Male bmc (kg) = 1.89 × height (m) + 0.017 × weight (kg) - 0.0015 × age (y) - 1.81
Female bmc (kg) = 1.57 × height (m) + 0.017 × weight (kg) - 0.009 × age (y) - 1.05
Statistical analyses
Differences in SUVs between male and female participants were tested with an unpaired two-sample t-test assuming equal variation. The relationships of SUVs with age, weight, and height were evaluated with a regression analysis. P-values < 0.05 indicate significant differences. All analyses were computed using JMP 10.0.2 (SAS Institute Inc., 2012, Cary, NC, USA).
Results
SUVmax, SUVpeak, and SUVmean
The mean ± SD of SUVmax, SUVpeak, and SUVmean of all 189 vertebrae were 7.1 ± 1.5, 6.2 ± 1.3, and 4.3 ± 0.9, respectively. The coefficient of variation (CoV) of SUVmax, SUVpeak, and SUVmean were 0.21, 0.21, and 0.22, respectively.
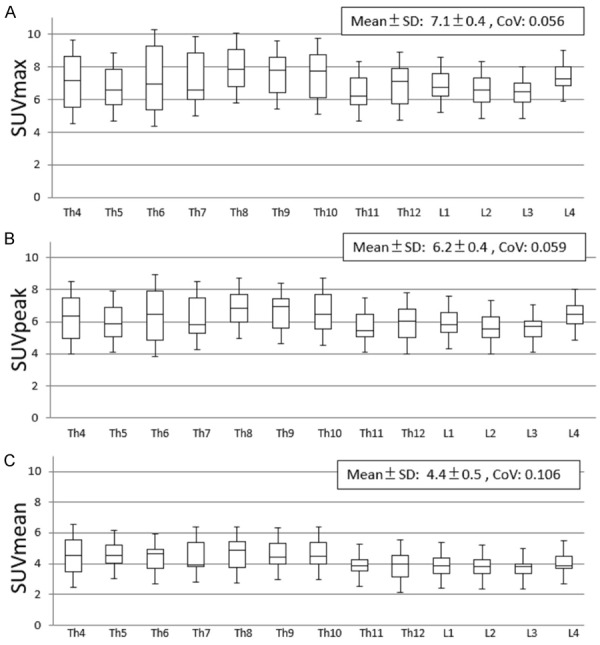
Among the 189 vertebrae for which SUVs were calculated, 16 vertebrae at 5 regions were excluded for the following statistical analyses because of small numbers of samples as follows; Th1 (n = 1), Th2 (1), Th3 (3), L5 (6), and S1 (5). Other regions of vertebrae had 10 or more samples (min, 10; max, 18; mean, 13.3). The mean ± SD of SUVmax, SUVpeak, and SUVmean were 7.1 ± 0.4, 6.2 ± 0.4, and 4.4 ± 0.5, respectively. The box-and-whisker plots of SUVmax, SUVpeak, and SUVmean of each vertebrae between Th4 and L4 are demonstrated in Figure 2. The highest CoV of SUVmax, SUVpeak, and SUVmean were seen at Th6 (0.254), Th11 (0.250), and Th7 (0.249), respectively. The lowest values were seen at L4 (0.133), L4 (0.140), and L4 (0.144), respectively.
Figure 2.

Box-and-whisker plots of SUVmax (A), SUVpeak (B) and SUVmean (C), showing a quantitative distribution of 5 standard statistics: Smallest value, lower quartile, median, upper quartile, and largest value. SD: Standard deviation, CoV: Coefficient of variation.
The mean individual SUVmax, SUVpeak, and SUVmean were 3.4-10.6, 2.9-9.5, and 1.8-7.0, respectively. The intra-individual CoV of SUVmax, SUVpeak, and SUVmean were 0.01-0.12 (mean, 0.070), 0.01-0.12 (0.063), and 0.02-0.13 (0.059), respectively.
SUVlbw, SUVjlbw, and SUVbone
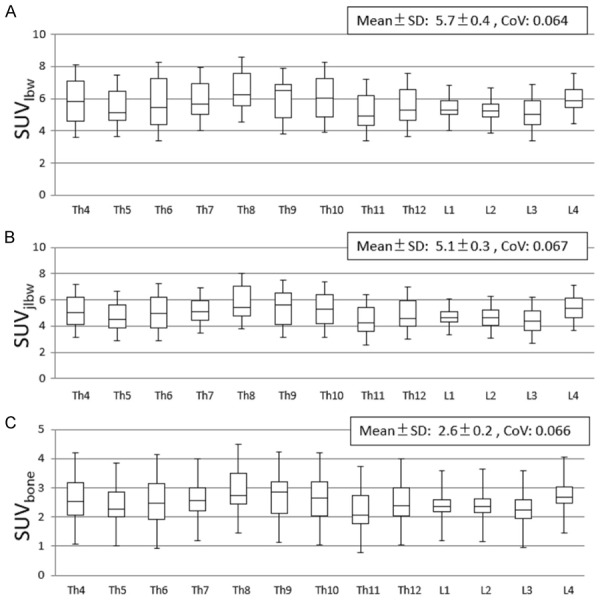
SUVlbw, SUVjlbw, and SUVbone were analyzed for vertebrae at Th4~L4. The mean ± SD of SUVlbw, SUVjlbw, and SUVbone were 5.7 ± 0.4, 5.1 ± 0.3, and 2.6 ± 0.2, respectively. The box-and-whisker plots of SUVlbw, SUVjlbw, and SUVbone of each vertebrae between Th4 and L4 are demonstrated in Figure 3. The highest CoV of SUVlbw, SUVjlbw, and SUVbone were seen at Th11 (0.288), Th11 (0.307), and Th11 (0.312), respectively. The lowest values were seen at L4 (0.144), L4 (0.159), and L4 (0.142), respectively.
Figure 3.

Box-and-whisker plots of SUVlbw (A), SUVjlbw (B), and SUVbone (C), showing a quantitative distribution of 5 standard statistics as with Figure 2.
The mean individual SUVlbw, SUVjlbw, and SUVbone were 2.6-9.2, 2.1-8.4, and 1.0-4.3, respectively. The intra-individual CoV of SUVlbw, SUVjlbw, and SUVbone were 0.01-0.12 (mean, 0.070), 0.01-0.12 (mean, 0.070), and 0.01-0.12 (mean, 0.070), respectively.
Correlation with age, weight, and height
All SUVs showed weak and no significant correlation with both age and weight. On the other hand, they showed moderate and significant correlation with height (Table 1).
Table 1.
Correlation coefficients between SUVs and age, weight and height
| SUVmax | SUVlbm | SUVjlbm | SUVbone | |
|---|---|---|---|---|
| Age | 0.26 | 0.16 | 0.11 | 0.16 |
| Weight | 0.32 | 0.20 | 0.14 | 0.17 |
| Height | 0.53* | 0.62* | 0.64* | 0.64* |
p < 0.05.
Differences between male and female participants
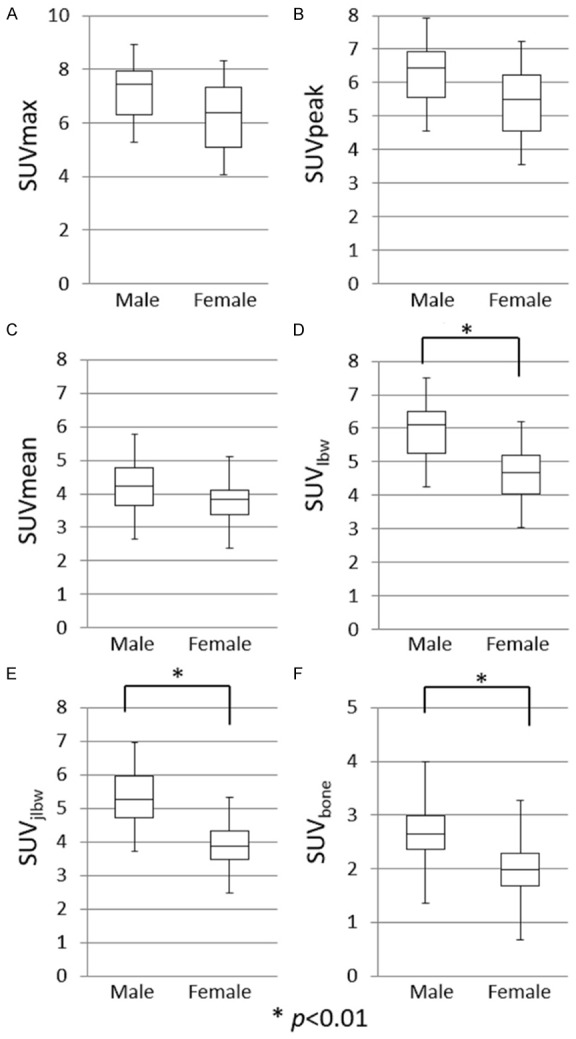
In this study, the average ages (mean ± SD) of male and female participants were 69.7 ± 6.7 and 64.1 ± 7.2, respectively. There were no significant differences between male and female participants with regard to the SUVmax, SUVpeak, and SUVmean. However, SUVlbw, SUVjlbw, and SUVbone showed significant differences between men and women (Figure 4), with the values for men being significantly higher.
Figure 4.

Box-and-whisker plots of SUVs (A-F) with a comparison between males and females, showing a quantitative distribution of 5 standard statistics: Smallest value, lower quartile, median, upper quartile, and largest value. SUVlbw (D), SUVjlbw (E), and SUVbone (F) showed significant differences between male and female participants (p < 0.01).
Discussion
As our results demonstrated, SUVs of normal vertebrae showed a wide variability. It seems difficult to determine a standard value for normal bone. We calculated and evaluated different SUVs, including SUVmax, SUVpeak, SUVmean, SUVlbw, SUVjlbw, and SUVbone. SUVmax, SUVpeak, and SUVmean were based on body-weight adjusted SUV, or SUVbw, which are the most widespread and easily calculated measurands on oncology PET using FDG. Among these, SUVmax showed the lowest CoV, suggesting that it had the smallest dispersion in values, but the differences from other SUVs were small. SUVlbw, is relatively complicated to calculate because it requires information of the height of the patient. SUVjlbw and SUVbone are also more complicated for calculation using the equations mentioned above. However, none of these values showed lower variability than SUVmax. Thus, SUVmax might be useful as an appropriate quantitative biomarker in bone SPECT/CT imaging. SUVs reduced in the order of SUVmax, SUVlbw, SUVjlbw, and SUVbone. This is thought to be caused by differences in sizes of the distribution volume.
On the other hand, the variability of SUVs within the subjects was relatively small. Thus, standardization with adequate reference in the same subject may improve the variability of SUVs. This method has been already used for the analysis of amyloid PET imaging of the brain, which calculates SUVr using the cerebellum as reference. From our results, L4 showed the lowest CoV for SUVmax, SUVpeak, and SUVmean, suggesting the possibility of serving as an optimal reference. However, we did not perform a validation assessment in this study, and further research is required to clarify this issue.
Our results demonstrated that SUVs showed moderate and significant correlation with the height of the subjects. To our knowledge, few studies have reported such a relationship. This fact suggests that taller subjects have a higher bone density than smaller subjects even if the body-weight or lean-body-weight is equal. The increase in physical burden due to a high center of gravity may increase bone density, but further research is required to clarify this finding. We did not show a significant correlation between SUVs and both age and weight; however, Cachovan et al. reported a significant negative correlation between age and both SUVbw and SUVlbw of Tc-99m diphosphono-propanedicarboxylic acid (DPD) SPECT [12]. The differences in results may be caused by the differences in the age of the subjects, tracers, attenuation correction method, SPECT reconstruction method, VOIs, sample size, etc. The age of the population in this study was relatively high and fell in a tight range (68.2 ± 6.7 years; minimum, 44 years; maximum, 87 years). This is thought to be the main reason why we could not find significant correlations between SUVs and age. In addition, Cachovan et al. [12] set VOIs in the spongious bone tissue; however, bone density is higher in the cortical bone than in spongious bone. Thus, we set VOIs at whole vertebrae including both cortical and spongious bone.
In our study, all SUVs tended to be higher in male participants. However, only SUVlbw, SUVjlbw, and SUVbone showed significant differences, and the others did not. A Chinese study with a large sample size that analyzed the bone mineral density (BMD) of men, premenopausal women, and postmenopausal women reported that BMD decreased in this order [13]. It is well known that the decline of BMD is more pronounced after menopause [14]. From the results of a Japanese study [11], BMD of elderly (60 + y.o.) men was higher than that of women. In this study, the mean age of male participants was about 5 years higher than that of female participants. Thus, the difference in BMD between male and female participants is thought to be significant. The SUVlbw, SUVjlbw, and SUVbone might be more sensitive than other SUVs for changes in BMD.
With advances in molecular imaging, quantitative measurements have become vastly more important. Researchers have developed various quantitative imaging biomarkers (QIBs); however, few of these QIBs are used routinely in clinical trials or clinical care [15]. The SUV is one of the most commonly used QIBs, especially in FDG PET, and is now available for SPECT through the use of SPECT/CT scanners. As the Quantitative Imaging Biomarkers Alliance (QIBA) of Radiological Society of North America recommended, QIBs must be a ratio or interval variable, which have a clear definition of zero and for which the ratio of two values can be meaningfully interpreted [16]. QIBs consist of only a measurement of a measurand or a measurement obtained while other specified or relevant factors are held constant. SUV is one of the examples of the latter concept. Here, the measurand is tissue radioactivity concentration at some time after injection. The SUV is calculated as the ratio of the value of the measure to the injected dose at the time of injection, divided by body weight (injected dose and weight being the relevant factors that are held constant). For example, SUV as measured with PET or SPECT is a ratio variable because if one tumor has an SUV of 6.0 and another tumor has an SUV of 2.0, the following statements based on arithmetic operations have real meaning: (a) the SUV of the larger tumor is 4.0 bigger than that of the smaller tumor, and (b) the SUV of the larger tumor is three times that of the smaller tumor. Furthermore, the zero value of SUV in a tumor indicates that there is no metabolic activity in a tumor mass. Thus, SUV has a distinct potential as a QIB, and is thought to be useful for the evaluation of the activities of bone lesions and the response to therapy. However, as mentioned earlier, SUVs of bone SPECT require standardization with adequate reference in the same subject to minimize variability.
Disclosure of conflict of interest
None.
References
- 1.Subramanian G, McAfee JG, Blair RJ, Kallfelz FA, Thomas FD. Technetium-99m-methylene diphosphonate: a superior agent for skeletal imaging-comparison with other technetium complexes. J Nucl Med. 1975;16:744–55. [PubMed] [Google Scholar]
- 2.Domstad PA, Coupal JJ, Kim EE, Blake JS, DeLand FH. 99mTc-Hydroxymethane diphosphonate: a new bone imaging agent with a low tin content. Radiology. 1980;136:209–11. doi: 10.1148/radiology.136.1.6446106. [DOI] [PubMed] [Google Scholar]
- 3.Love C, Din AS, Tomas MB, Kalapparambath TP, Palestro CJ. Radionuclide bone imaging: an illustrative review. Radiographics. 2003;23:341–58. doi: 10.1148/rg.232025103. [DOI] [PubMed] [Google Scholar]
- 4.Mari C, Catafau A, Carrio I. Bone scintigraphy and metabolic disorders. Q J Nucl Med. 1999;43:259–67. [PubMed] [Google Scholar]
- 5.Schwartz Z, Shani J, Soskolne WA, Touma H, Amir D, Sela J. Uptake and biodistribution of technetium-99m-MD32P during rat tibial bone repair. J Nucl Med. 1993;34:104–8. [PubMed] [Google Scholar]
- 6.Toegel S, Hoffmann O, Wadsak W, Ettlinger D, Mien LK, Wiesner K, Nguemo J, Viernstein H, Kletter K, Dudczak R, Mitterhauser M. Uptake of boneseekers is solely associated with mineralization: a study with 99mTc-MDP, 153Sm-EDTMP and 18F-fluoride on osteoblasts. Eur J Nucl Med Mol Imaging. 2006;33:491–4. doi: 10.1007/s00259-005-0026-x. [DOI] [PubMed] [Google Scholar]
- 7.Keyes JW Jr. SUV: standard uptake or silly useless value? J Nucl Med. 1995;36:1836–1839. [PubMed] [Google Scholar]
- 8.Waterval JJ, Vallinga M, Brans B, Winkens B, Stokroos RJ. 18F-fluoride PET/CT scan for quantification of bone metabolism in the inner ear in patients with otosclerosis-a pilot study. Clin Nucl Med. 2013;38:677–85. doi: 10.1097/RLU.0b013e31829a013e. [DOI] [PubMed] [Google Scholar]
- 9.Söderberg M, Gunnarsson M. The effect of different adaptation strengths on image quality and radiation dose using Siemens Care Dose 4D. Radiat Prot Dosimetry. 2010;139:173–9. doi: 10.1093/rpd/ncq098. [DOI] [PubMed] [Google Scholar]
- 10.Römer W, Reichel N, Vija HA, Nickel I, Hornegger J, Bautz W, Kuwert T. Isotropic reconstruction of SPECT data using OSEM3D: correlation with CT. Acad Radiol. 2006;13:496–502. doi: 10.1016/j.acra.2005.12.004. [DOI] [PubMed] [Google Scholar]
- 11.Ito H, Ohshima A, Ohto N, Ogasawara M, Tsuzuki M, Takao K, Hijii C, Tanaka H, Nishioka K. Relation between body composition and age in healthy Japanese subjects. Eur J Clin Nutr. 2001;55:462–70. doi: 10.1038/sj.ejcn.1601206. [DOI] [PubMed] [Google Scholar]
- 12.Cachovan M, Vija AH, Hornegger J, Kuwert T. Quantification of 99mTc-DPD concentration in the lumbar spine with SPECT/CT. EJNMMI Res. 2013;3:45. doi: 10.1186/2191-219X-3-45. [DOI] [PMC free article] [PubMed] [Google Scholar]
- 13.Hsu YH, Venners SA, Terwedow HA, Feng Y, Niu T, Li Z, Laird N, Brain JD, Cummings SR, Bouxsein ML, Rosen CJ, Xu X. Relation of body composition, fat mass, and serum lipids to osteoporotic fractures and bone mineral density in Chinese men and women. Am J Clin Nutr. 2006;83:146–54. doi: 10.1093/ajcn/83.1.146. [DOI] [PubMed] [Google Scholar]
- 14.Cummings SR, Nevitt MC, Browner WS, Stone K, Fox KM, Ensrud KE, Cauley J, Black D, Vogt TM. Risk factors for hip fracture in white women. Study of Osteoporotic Fractures Research Group. N Engl J Med. 1995;332:767–73. doi: 10.1056/NEJM199503233321202. [DOI] [PubMed] [Google Scholar]
- 15.Sullivan DC, Obuchowski NA, Kessler LG, Raunig DL, Gatsonis C, Huang EP, Kondratovich M, McShane LM, Reeves AP, Barboriak DP, Guimaraes AR, Wahl RL RSNA-QIBA Metrology Working Group. Metrology Standards for Quantitative Imaging Biomarkers. Radiology. 2015;277:813–25. doi: 10.1148/radiol.2015142202. [DOI] [PMC free article] [PubMed] [Google Scholar]
- 16.Stevens SS. On the theory of scales of measurement. Science. 1946;103:677–80. doi: 10.1126/science.103.2684.677. [DOI] [PubMed] [Google Scholar]


